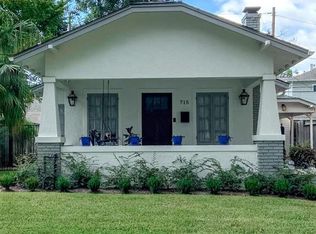
Cute Bungalow in the Heights with 2 bedrooms and 2 baths, Hardwood floors, open floor plan, 1150 square feet, and all appliances including washer and dryer. We do allow pets with a pet fee, pet deposit or both depending on the type, size, and number of pets.
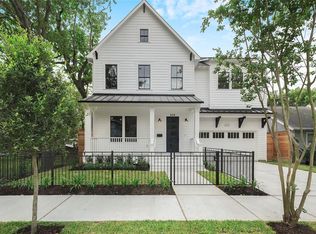
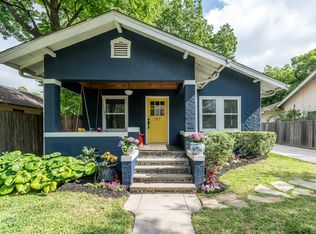
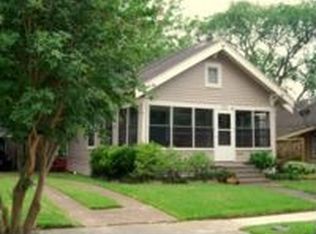
This property is off market, which means it's not currently listed for sale or rent on Zillow. This may be different from what's available on other websites or public sources.