Excellent opportunity to own a residential lot in the growing NW Cape Coral area! Priced aggressively for a quick sale, this property is perfect for investors or future homeowners looking to build in a rapidly developing neighborhood. Conveniently located near schools, shopping, dining, and main roads with easy access to Fort Myers. No HOA. Well and septic area. Don’t miss this chance to secure land at a great value in one of Cape Coral’s fastest-growing areas!
Active
$25,000
710 NW 3rd Pl, Cape Coral, FL 33993
--beds
--baths
10,018Square Feet
Unimproved Land
Built in ----
10,018 Square Feet Lot
$-- Zestimate®
$--/sqft
$-- HOA
What's special
- 194 days
- 144
- 11
Zillow last checked:
Listing updated:
Listed by:
Denisse Meza 239-737-5226,
Realty One Group MVP
Source: Florida Gulf Coast MLS,MLS#: 2026021474 Originating MLS: Florida Gulf Coast
Facts & features
Property
Features
- Waterfront features: None
Lot
- Size: 10,018 Square Feet
- Dimensions: 80 x 125 x 80 x 125
- Features: Rectangular Lot
Details
- Parcel number: 114423C202558.0240
- Lease amount: $0
- Zoning description: R1-D
Utilities & green energy
- Sewer: Septic Tank
- Water: Well
- Utilities for property: Electricity Available, Phone Available, Trash Collection
Community & HOA
Community
- Features: Non-Gated
- Condo and coop fee: $0
- Membership fee: $0
- Subdivision: CAPE CORAL
HOA
- Services included: None
Location
- Region: Cape Coral
Financial & listing details
- Tax assessed value: $60,563
- Annual tax amount: $2,125
- Date on market: 5/11/2026
- Cumulative days on market: 195 days
- Listing terms: Cash
- Electric utility on property: Yes
- Road surface type: Paved
Estimated market value
Not available
Estimated sales range
Not available
Not available
Price history
| Date | Event | Price |
|---|---|---|
| 5/11/2026 | Listed for sale | $25,000-21.9% |
Source:  Florida Gulf Coast MLS #2026021474 Report a problem | ||
| 3/17/2026 | Listing removed | $32,000 |
Source: Florida Gulf Coast MLS #2025025188 Report a problem | ||
| 2/26/2026 | Listed for sale | $32,000 |
Source: Florida Gulf Coast MLS #2025025188 Report a problem | ||
| 1/28/2026 | Pending sale | $32,000 |
Source: Florida Gulf Coast MLS #2025025188 Report a problem | ||
| 1/20/2026 | Price change | $32,000-8.6% |
Source: Florida Gulf Coast MLS #2025025188 Report a problem | ||
| 1/20/2026 | Pending sale | $35,000 |
Source: Florida Gulf Coast MLS #2025025188 Report a problem | ||
| 1/7/2026 | Listed for sale | $35,000 |
Source: Florida Gulf Coast MLS #2025025188 Report a problem | ||
| 1/3/2026 | Pending sale | $35,000 |
Source: Florida Gulf Coast MLS #2025025188 Report a problem | ||
| 12/18/2025 | Listed for sale | $35,000+24.5% |
Source: Florida Gulf Coast MLS #2025025188 Report a problem | ||
| 2/23/2023 | Sold | $28,118+66.4% |
Source: Public Record Report a problem | ||
| 6/26/2015 | Sold | $16,900+125.3% |
Source: Public Record Report a problem | ||
| 7/26/2013 | Sold | $7,500 |
Source: Public Record Report a problem | ||
Public tax history
| Year | Property taxes | Tax assessment |
|---|---|---|
| 2025 | $2,125 +4.6% | $52,104 +10% |
| 2024 | $2,031 -32.2% | $47,367 +305.5% |
| 2023 | $2,993 +2.8% | $11,680 +10% |
| 2022 | $2,911 +5.2% | $10,618 +10% |
| 2021 | $2,768 -6.8% | $9,653 +10% |
| 2020 | $2,968 -0.2% | $8,775 -26.9% |
| 2019 | $2,973 | $12,000 |
| 2018 | $2,973 +0.4% | $12,000 +10.9% |
| 2017 | $2,962 +572.1% | $10,821 +54.6% |
| 2016 | $441 +13.9% | $7,000 +12.9% |
| 2015 | $387 +10.7% | $6,200 +9.9% |
| 2014 | $349 +21% | $5,640 +25.3% |
| 2013 | $289 +58.4% | $4,500 +28.6% |
| 2012 | $182 -2.4% | $3,500 -14.6% |
| 2011 | $187 -24.9% | $4,100 -35.9% |
| 2010 | $249 -9.5% | $6,400 -20% |
| 2009 | $275 +0.5% | $8,000 -33.3% |
| 2008 | $273 -59.5% | $12,000 -65.7% |
| 2007 | $674 -46.3% | $35,000 -47.1% |
| 2006 | $1,256 +422.3% | $66,200 +611.8% |
| 2004 | $240 +87.7% | $9,300 +123.6% |
| 2003 | $128 +55.2% | $4,160 +89.1% |
| 2002 | $83 | $2,200 +12.2% |
| 2000 | -- | $1,960 |
Find assessor info on the county website
Monthly payment
Climate risks
Neighborhood: 33993


Similar homes
- $25,00010,018 sqft2123 NE 27th Ter, Cape Coral, FL 33909Lot/Land
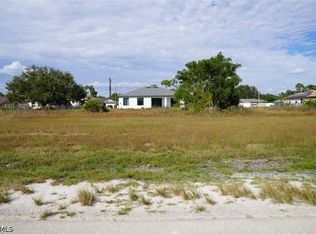
 MLS ID #2026048778, Oscar Arroliga, EXP Realty LLC. Florida Gulf Coast MLS
- $28,99010,628 sqft2732 NW 11th TER, CAPE CORAL, FL 33993Lot/Land

 MLS ID #226041791, Derek Eisenberg, Continental Real Estate Group. SWFLMLS
- $25,0005,619 sqft2532 Santa Barbara Blvd N, Cape Coral, FL 33993New Construction
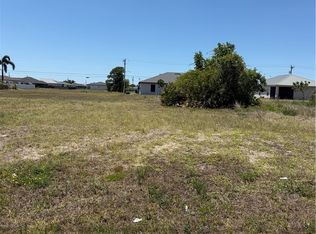 MLS ID #2026017809, Carolyn Gardewine, Century 21 AllPoints Realty. Florida Gulf Coast MLS
- $30,00010,018 sqft2908 Tropicana Pkwy W, Cape Coral, FL 33993Lot/Land
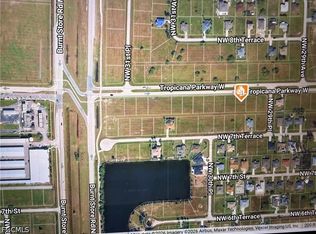 MLS ID #2026043159, Carolina Tiuso, Tiuso Realty Group. Florida Gulf Coast MLS
- $30,90010,018 sqft1524 NW 41st Pl, Cape Coral, FL 33993Lot/LandMLS ID #2026046866, Mike Lombardo, Old Glory Realty. Florida Gulf Coast MLS
- $35,00010,628 sqft1634 NW 1st Ave, Cape Coral, FL 33993Lot/LandMLS ID #2026032441, Angelina Preciado, Real Broker, LLC. Florida Gulf Coast MLS
- $30,50010,018 sqft1405 NW 11th St, Cape Coral, FL 33993Lot/LandMLS ID #2026027375, Arletis Fernandez, Innova Real Estate Corp. Florida Gulf Coast MLS
- $35,00010,018 sqft1015 NW 13th St, Cape Coral, FL 33993Lot/LandMLS ID #2026023779, Naivi Velazco, Innova Real Estate Corp. Florida Gulf Coast MLS
- $33,50010,018 sqft1203 NW 9th Pl, Cape Coral, FL 33993Lot/LandMLS ID #2026036920, Wilda Oyarzun, Red Door Realty Brokers, Inc. Florida Gulf Coast MLS
- $32,50010,018 sqft1821 NW 7th AVE, CAPE CORAL, FL 33993Lot/LandMLS ID #225080459, Lisset Franco, LLC, eXp Realty LLC. SWFLMLS
- $35,00010,105 sqft2710 NW 4th Pl, Cape Coral, FL 33993Lot/LandMLS ID #2026033650, Heather Craig, EXP Realty LLC. Florida Gulf Coast MLS
- $35,00010,018 sqft1722 NW 14th St, Cape Coral, FL 33993Lot/LandMLS ID #2026036187, James Bagley, Commerce Brokerage LLC. Florida Gulf Coast MLS
- $22,5006,229 sqft2713 Santa Barbara Blvd N, Cape Coral, FL 33993Lot/LandMLS ID #225055139, Sury Duque, Coldwell Banker Sunstar Realty. Florida Gulf Coast MLS
- $35,00010,628 sqft2917 NW 25th Ter, Cape Coral, FL 33993Lot/LandMLS ID #2026045725, Arturo Sanchez Caram, Starlink Realty, Inc. Florida Gulf Coast MLS
- $19,9505,009 sqft2912 Santa Barbara Blvd N, Cape Coral, FL 33993Lot/LandMLS ID #2026009772, Cassie Sanabria, Dalton Wade Inc. Florida Gulf Coast MLS
- $29,00010,018 sqft2115 NW 41st PL, CAPE CORAL, FL 33993Lot/LandMLS ID #226037558, Gabriel Penton, Invest Ready Realty. SWFLMLS
- $29,00010,018 sqft1622 NW 1st Ter, Cape Coral, FL 33993Lot/LandMLS ID #225051047, Andrea Mize, Premier Florida Realty of SWFL. Florida Gulf Coast MLS
- $29,90010,628 sqft2904 NW 19th Ter, Cape Coral, FL 33993Lot/LandMLS ID #2026008649, Brian Vickers, LoKation. Florida Gulf Coast MLS
- $35,99010,629 sqft2724 NW 11TH STREET LOT 9, CAPE CORAL, FL 33993Lot/Land
 MLS ID #C7530433, Kevin Heikes, COLDWELL BANKER REALTY. Stellar MLS
- $31,50010,625 sqft2908 NW 19TH Street, Cape Coral, FL 33993Lot/Land
 MLS ID #B26072028, Daniel Castaneda, American Realty of PSL LLC. BeachesMLS
