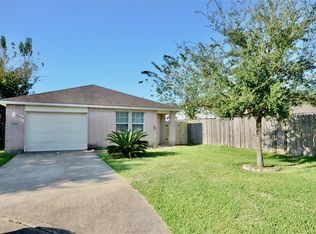
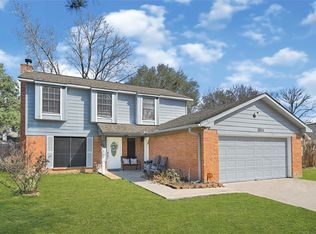
Welcome to 7118 Rising Brook Dr, a spacious two-story home located in Cypress, TX 77433. This well-designed 2 story residence offers 5 bedrooms and 2.5 bathrooms, providing ample space for comfortable everyday living and flexible use of rooms for guests, home office, or additional living needs. Located in an established Cypress neighborhood, the property offers convenient access to nearby schools, shopping, dining, and major roadways, making commuting and daily errands simple and efficient.
For sale
Price cut: $10K (5/24)
$260,000
7118 Rising Brook Dr, Cypress, TX 77433
5beds
1,965sqft
Single Family Residence
Built in 2005
5,366 Square Feet Lot
$-- Zestimate®
$132/sqft
$40/mo HOA
What's special
- 33 days |
- 649 |
- 76 |
Zillow last checked:
Listing updated:
Listed by:
Katherin Mejia TREC #0838927 832-686-3192,
Peak Real Estate,
Emily Rodriguez TREC #0767428 936-447-0175,
Peak Real Estate
Source: HAR,MLS#: 51209991
Loading...
Facts & features
Interior
Bedrooms & bathrooms
- Bedrooms: 5
- Bathrooms: 3
- Full bathrooms: 2
- 1/2 bathrooms: 1
Heating
- Electric
Cooling
- Electric
Appliances
- Included: Microwave, Dishwasher
Features
- All Bedrooms Up
Interior area
- Total structure area: 1,965
- Total interior livable area: 1,965 sqft
Property
Parking
- Total spaces: 1
- Parking features: Attached
- Attached garage spaces: 1
Features
- Stories: 2
Lot
- Size: 5,366 Square Feet
- Features: Subdivided, 0 Up To 1/4 Acre
Details
- Parcel number: 1260680030015
Construction
Type & style
- Home type: SingleFamily
- Architectural style: Traditional
- Property subtype: Single Family Residence
Materials
- Brick
- Foundation: Slab
- Roof: Composition
Condition
- New construction: No
- Year built: 2005
Utilities & green energy
- Sewer: Public Sewer
- Water: Public
Community & HOA
Community
- Subdivision: Tealbrook
HOA
- Has HOA: Yes
- HOA fee: $475 annually
Location
- Region: Cypress
Financial & listing details
- Price per square foot: $132/sqft
- Tax assessed value: $272,236
- Annual tax amount: $6,045
- Date on market: 5/24/2026
Estimated market value
Not available
Estimated sales range
Not available
$2,456/mo
Price history
| Date | Event | Price |
|---|---|---|
| 5/24/2026 | Price change | $260,000-3.7%$132/sqft |
Source: | ||
| 4/21/2026 | Listed for sale | $270,000+3.9%$137/sqft |
Source: | ||
| 3/31/2023 | Listing removed | -- |
Source: | ||
| 3/28/2023 | Listing removed | -- |
Source: | ||
| 3/23/2023 | Listed for rent | $2,000$1/sqft |
Source: | ||
| 3/14/2023 | Listed for sale | $259,900$132/sqft |
Source: | ||
| 3/8/2023 | Pending sale | $259,900$132/sqft |
Source: | ||
| 3/1/2023 | Listed for sale | $259,900$132/sqft |
Source: | ||
| 2/23/2023 | Pending sale | $259,900$132/sqft |
Source: | ||
| 1/1/2023 | Price change | $259,900-3.7%$132/sqft |
Source: | ||
| 11/29/2022 | Listed for sale | $270,000-6.1%$137/sqft |
Source: | ||
| 11/6/2022 | Listing removed | -- |
Source: | ||
| 9/27/2022 | Price change | $287,500-2.5%$146/sqft |
Source: | ||
| 7/5/2022 | Listed for sale | $295,000$150/sqft |
Source: | ||
Public tax history
| Year | Property taxes | Tax assessment |
|---|---|---|
| 2025 | $1,444 +12.4% | $272,236 +1.2% |
| 2024 | $1,285 | $268,965 -8.9% |
| 2023 | -- | $295,308 +24.1% |
| 2022 | $991 | $237,999 +28.5% |
| 2021 | -- | $185,258 +5.4% |
| 2020 | $908 +8.3% | $175,772 +9.1% |
| 2019 | $838 -67.9% | $161,081 +9.9% |
| 2018 | $2,611 | $146,549 |
| 2017 | $2,611 +4.6% | $146,549 +9.3% |
| 2016 | $2,495 +9.3% | $134,134 +8.1% |
| 2015 | $2,283 | $124,123 +18.6% |
| 2014 | $2,283 | $104,667 +44.6% |
| 2013 | -- | $72,390 +8.5% |
| 2012 | -- | $66,694 -9.5% |
| 2011 | -- | $73,661 |
| 2010 | -- | $73,661 -25.9% |
| 2009 | -- | $99,369 -10.5% |
| 2007 | -- | $111,008 -3.4% |
| 2006 | -- | $114,972 |
Find assessor info on the county website
Monthly payment
Est. payment$--/mo
Payment breakdown
Explore the cost of this home by adjusting the details. Changes won't be saved.All calculations are estimates and provided by Zillow, Inc. for informational purposes only. Actual amounts may vary.
HOA fees may include property taxes on listings classified as Co-Ops. Contact the listing agent and/or owner for fee details.
Mortgage interest rates are dependent on a number of factors, including credit score, down payment, and repayment length. Interest rate data provided by Zillow Group Marketplace, Inc. as of 1/1/1970 from various mortgage lenders with which we have lead or other similar arrangements; the Estimated Payment is an average of those rates.
See how much you could borrow to make a competitive offer.
Climate risks
Neighborhood: Cypress Springs
Nearby schools
GreatSchools rating
- 4/10Duryea Elementary SchoolGrades: PK-5Distance: 0.6 mi
- 4/10Hopper Middle SchoolGrades: 6-8Distance: 0.5 mi
- 4/10Cypress Springs High SchoolGrades: 9-12Distance: 0.7 mi
Schools provided by the listing agent
- Elementary: Duryea Elementary School
- Middle: Hopper Middle School
- High: Cypress Springs High School
Source: HAR. This data may not be complete. We recommend contacting the local school district to confirm school assignments for this home.

A local agent can set up tours, give advice and negotiate with sellers.
A local lender can help you make sure your offer is ready when you are.


- Texas
- Harris County
- Cypress
- 77433
- Cypress Springs
- 7118 Rising Brook Dr
Nearby cities
Nearby neighborhoods
Nearby zip codes
Other Cypress Topics
