INVESTOR'S SPECIAL!!! 3 Bed Room / 1 Bath home in need of total renovation. Incredible investment property potential. Cash Only! Inspections are for informational purposes only. SOLD AS-IS
Active
$45,000
718 13th Ave, Franklinton, LA 70438
3beds
1,250sqft
Single Family Residence
Built in 1970
0.48 Acres Lot
$-- Zestimate®
$36/sqft
$-- HOA
What's special
- 1 day
- 80
- 2
Zillow last checked:
Listing updated:
Listed by:
Isola Williams 985-801-9755,
Goings Group Real Estate Services, Inc. 985-322-2103
Source: GSREIN,MLS#: 2582232
Facts & features
Interior
Bedrooms & bathrooms
- Bedrooms: 3
- Bathrooms: 1
- Full bathrooms: 1
Bedroom
- Level: Lower
Bedroom
- Level: Lower
Bedroom
- Level: Lower
Heating
- None
Cooling
- None
Features
- Has fireplace: No
- Fireplace features: None
Interior area
- Total structure area: 1,324
- Total interior livable area: 1,250 sqft
Property
Parking
- Parking features: Off Street
Features
- Levels: One
- Stories: 1
- Patio & porch: None, Porch
- Exterior features: Porch
- Pool features: None
Lot
- Size: 0.48 Acres
- Dimensions: 104 x 200 x 105 x 200
- Features: City Lot, Rectangular Lot
Details
- Parcel number: 0330165300
- Special conditions: None
Construction
Type & style
- Home type: SingleFamily
- Architectural style: Traditional
- Property subtype: Single Family Residence
Materials
- Wood Siding
- Foundation: Raised
- Roof: Shingle
Condition
- Poor Condition
- Year built: 1970
Utilities & green energy
- Sewer: Public Sewer
- Water: Public
Community & HOA
Community
- Subdivision: Not a Subdivision
HOA
- Has HOA: No
Location
- Region: Franklinton
Financial & listing details
- Price per square foot: $36/sqft
- Tax assessed value: $18,000
- Annual tax amount: $150
- Date on market: 10/20/2026
Estimated market value
Not available
Estimated sales range
Not available
$943/mo
Price history
| Date | Event | Price |
|---|---|---|
| 10/21/2026 | Listed for sale | $45,000+52.5%$36/sqft |
Source:  GSREIN #2582232 Report a problem | ||
| 9/11/2025 | Listing removed | $29,500$24/sqft |
Source: GSREIN #2490908 Report a problem | ||
| 8/8/2025 | Price change | $29,500-15.7%$24/sqft |
Source: GSREIN #2490908 Report a problem | ||
| 7/17/2025 | Listed for sale | $35,000$28/sqft |
Source: GSREIN #2490908 Report a problem | ||
| 7/2/2025 | Contingent | $35,000$28/sqft |
Source: GSREIN #2490908 Report a problem | ||
| 5/27/2025 | Price change | $35,000-12.5%$28/sqft |
Source: GSREIN #2490908 Report a problem | ||
| 4/14/2025 | Price change | $40,000-20%$32/sqft |
Source: GSREIN #2490908 Report a problem | ||
| 3/11/2025 | Listed for sale | $50,000+42.9%$40/sqft |
Source: GSREIN #2490908 Report a problem | ||
| 3/7/2025 | Listing removed | $35,000$28/sqft |
Source: GSREIN #2455598 Report a problem | ||
| 12/9/2024 | Contingent | $35,000$28/sqft |
Source: GSREIN #2455598 Report a problem | ||
| 10/25/2024 | Price change | $35,000-12.5%$28/sqft |
Source: GSREIN #2455598 Report a problem | ||
| 9/16/2024 | Price change | $40,000-11.1%$32/sqft |
Source: GSREIN #2455598 Report a problem | ||
| 8/12/2024 | Price change | $45,000-10%$36/sqft |
Source: GSREIN #2455598 Report a problem | ||
| 7/23/2024 | Listed for sale | $50,000$40/sqft |
Source: GSREIN #2455598 Report a problem | ||
| 7/16/2024 | Contingent | $50,000$40/sqft |
Source: GSREIN #2455598 Report a problem | ||
| 6/27/2024 | Listed for sale | $50,000$40/sqft |
Source: GSREIN #2455598 Report a problem | ||
Public tax history
| Year | Property taxes | Tax assessment |
|---|---|---|
| 2025 | $150 +0.5% | $1,800 |
| 2024 | $150 -0.3% | $1,800 |
| 2023 | $150 -12.1% | $1,800 |
| 2022 | $171 -18.9% | $1,800 |
| 2021 | $211 +0.1% | $1,800 |
| 2020 | $211 +18.7% | $1,800 |
| 2017 | $177 | $1,800 |
| 2015 | $177 -21.8% | $1,800 |
| 2013 | $227 +68.1% | $1,800 |
| 2012 | $135 -38.5% | $1,800 |
| 2011 | $219 -2.6% | $1,800 |
| 2010 | $225 | $1,800 |
Find assessor info on the county website
Monthly payment
Est. payment
Payment breakdown
Explore the cost of this home by adjusting the details. Changes won't be saved.Climate risks
Neighborhood: 70438

Similar homes
- $45,0004 bd1 ba1.5k sqft57016 Highway 439, Bogalusa, LA 70427For Sale

 MLS ID #2569212, Sherrie Ybarzabal, Keller Williams Realty Services. GSREIN
- $50,0002 bd2 ba1.4k sqft818 K Ave, Bogalusa, LA 70427For Sale
 MLS ID #2569155, Charlotte Johnson, Keller Williams Realty Services. GSREIN
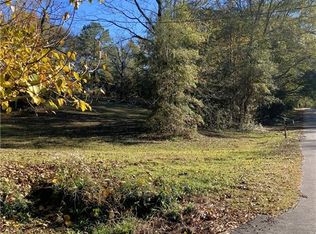
- $50,0001 bd-- ba695 sqft82060 Green Hills Dr, Covington, LA 70435For Sale
 MLS ID #2534665, Tontinette Barletto, Smith & Core, Inc.. GSREIN
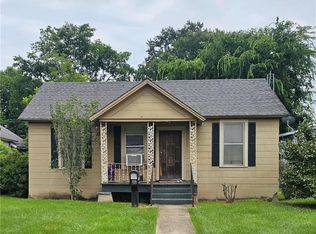
- $54,5002 bd1 ba1k sqft734 Avenue E, Bogalusa, LA 70427For Sale
 MLS ID #2563605, Teressa Gorman, Elite Real Estate Advisors . GSREIN
- $64,9003 bd1 ba1.4k sqft717 Avenue L, Bogalusa, LA 70427For SaleMLS ID #2567414, Dena Willett, South Central Realty, LLC. GSREIN
