This 1258 square foot single family home has 3 bedrooms and 2.0 bathrooms. This home is located at 7213 Coronet Ct, Citrus Heights, CA 95621.
Foreclosed
Est. $476,265
7213 Coronet Ct, Citrus Heights, CA 95621
3beds
1,258sqft
SingleFamily
Built in 1951
0.27 Acres Lot
$-- Zestimate®
$379/sqft
$-- HOA
Overview
- 82 days
- 72
- 3
Facts & features
Interior
Bedrooms & bathrooms
- Bedrooms: 3
- Bathrooms: 2
- Full bathrooms: 1
- 1/2 bathrooms: 1
Heating
- Forced air, Gas
Cooling
- Central
Appliances
- Included: Dishwasher, Garbage disposal, Refrigerator, Trash compactor
- Laundry: Electric Dryer Hookup, Inside Room, ground floor
Features
- Flooring: Tile, Carpet, Linoleum / Vinyl
- Has fireplace: Yes
Interior area
- Structure area source: Assessor Agent-Fill
- Total interior livable area: 1,258 sqft
Property
Parking
- Total spaces: 2
- Parking features: Garage - Attached
Features
- Fencing: Back Yard, Gate
Lot
- Size: 0.27 Acres
- Features: Cul-de-Sac, Street Lights, Curb(s)/Gutter(s), Auto Sprinkler F&R
Details
- Additional structures: Outbuilding
- Parcel number: 21103510110000
- Zoning: RD5
- Special conditions: Standard
Construction
Type & style
- Home type: SingleFamily
- Architectural style: Cottage
Materials
- wood frame
- Roof: Composition
Condition
- Year built: 1951
Utilities & green energy
- Sewer: In & Connected
- Water: Meter on Site
- Utilities for property: Natural Gas Available, Cable Connected, All Public
Community & HOA
Location
- Region: Citrus Heights
Financial & listing details
- Price per square foot: $379/sqft
- Tax assessed value: $476,265
- Road surface type: Paved
Foreclosure details
Estimated market value
Not available
Estimated sales range
Not available
$2,313/mo
Price history
| Date | Event | Price |
|---|---|---|
| 7/29/2026 | Sold | $362,700-17.6%$288/sqft |
Source: Public Record Report a problem | ||
| 8/18/2021 | Sold | $440,000+3.5%$350/sqft |
Source: MetroList Services of CA #221052748 Report a problem | ||
| 7/9/2021 | Pending sale | $425,000$338/sqft |
Source: MetroList Services of CA #221052748 Report a problem | ||
| 6/24/2021 | Listed for sale | $425,000$338/sqft |
Source: MetroList Services of CA #221052748 Report a problem | ||
| 5/8/2021 | Listing removed | -- |
Source: MetroList Services of CA Report a problem | ||
| 5/7/2021 | Listed for sale | $425,000$338/sqft |
Source: MetroList Services of CA #221036620 Report a problem | ||
| 5/4/2021 | Pending sale | $425,000$338/sqft |
Source: MetroList Services of CA #221036620 Report a problem | ||
| 4/23/2021 | Listed for sale | $425,000+184.3%$338/sqft |
Source: MetroList Services of CA #221036620 Report a problem | ||
| 7/26/2001 | Sold | $149,500$119/sqft |
Source: Public Record Report a problem | ||
Public tax history
| Year | Property taxes | Tax assessment |
|---|---|---|
| 2026 | -- | $476,265 +2% |
| 2025 | $5,574 +0.9% | $466,928 +2% |
| 2024 | $5,521 +2.6% | $457,774 +2% |
| 2023 | $5,381 +0.5% | $448,799 +2% |
| 2022 | $5,354 +121.6% | $440,000 +116.1% |
| 2021 | $2,416 +1.9% | $203,587 +1% |
| 2020 | $2,370 +2.1% | $201,501 +2% |
| 2019 | $2,321 +1.2% | $197,551 +2% |
| 2018 | $2,293 +1.1% | $193,679 +2% |
| 2017 | $2,269 +7.1% | $189,882 +2% |
| 2016 | $2,120 +4% | $186,160 +1.5% |
| 2015 | $2,038 | $183,365 +2% |
| 2014 | $2,038 | $179,774 +13.4% |
| 2013 | -- | $158,590 +14% |
| 2012 | -- | $139,115 -6% |
| 2011 | -- | $147,996 -8% |
| 2010 | -- | $160,866 -4.1% |
| 2008 | -- | $167,780 +2% |
| 2007 | -- | $164,492 +2% |
| 2006 | -- | $161,268 +2% |
| 2005 | -- | $158,107 +2% |
| 2004 | -- | $155,008 +1.9% |
| 2003 | -- | $152,168 +2% |
| 2002 | -- | $149,185 +30% |
| 2001 | -- | $114,727 +2% |
| 2000 | -- | $112,479 |
Find assessor info on the county website
Monthly payment
Climate risks
Neighborhood: Rusch Park
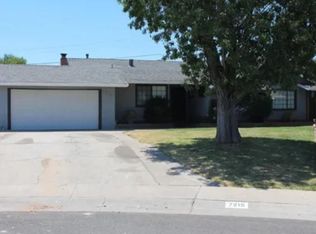
- $445,0004 bd2 ba1.5k sqft7215 Coronet Ct, Citrus Heights, CA 95621Sold
- $386,5003 bd1 ba1k sqft7107 Witchinghour Ct, Citrus Heights, CA 95621Off Market
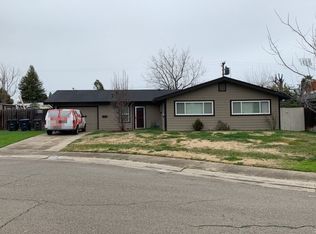
- $382,7003 bd1 ba1k sqft7211 Coronet Ct, Citrus Heights, CA 95621Off Market
- $405,1003 bd1 ba1k sqft7113 Witchinghour Ct, Citrus Heights, CA 95621Off Market
Similar homes
- $449,5003 bd2 ba1.1k sqft7372 Black Oaks Way, Citrus Heights, CA 95621For Sale
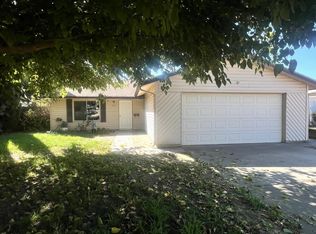 MLS ID #226119414, Kallie Orr Orr. MetroList Services of CA
- $509,9503 bd2 ba1.6k sqft6546 Greencreek Way, Citrus Heights, CA 95621For Sale
 MLS ID #226081284, Karen Henson. MetroList Services of CA
- $449,9993 bd2 ba1.2k sqft5300 Valparaiso Cir, Sacramento, CA 95841For Sale
 MLS ID #226125986, Lorretta Carlson. MetroList Services of CA
- $449,0004 bd2 ba1.2k sqft4521 Brandt Way, North Highlands, CA 95660For Sale
 MLS ID #226122481, Francisco Avila. MetroList Services of CA
