Welcome to 723 E 76th St, a spacious duplex offering an excellent opportunity for investors and owner-users alike. This two-unit property features two generously sized residences, each offering 5 bedrooms and 3 bathrooms, providing an impressive total of 10 bedrooms and 6 bathrooms. Situated on a 5,104-square-foot lot, the property offers ample living space and a versatile layout with approximately $60,000 in upgrades completed in 2026. The front unit features updated finishes including granite countertops, stainless steel appliances, subway tile, and laminate flooring, creating a modern and inviting living environment. The property also offers strong rental potential, with one unit generating $4,282 in monthly rental income. Located in the Los Angeles Southwest area, this substantial multi-unit property combines generous living space, thoughtful improvements, and excellent versatility for an investor or owner-user.
For sale
Listed by: Century 21 A Better Service • Chris Limon • Contact: 562-244-8211
$1,189,000
723 E 76th Pl, Los Angeles, CA 90001
10beds
6baths
3,512sqft
Duplex
Built in 2016
-- sqft lot
$1,183,500 Zestimate®
$339/sqft
$-- HOA
What's special
- 29 days
- 187
- 14
Zillow last checked:
Listing updated:
Listed by:
Chris Limon DRE #01182471 562-244-8211,
Century 21 A Better Service
Source: CRMLS,MLS#: DW26205139 Originating MLS: California Regional MLS
Facts & features
Interior
Bedrooms & bathrooms
- Bedrooms: 10
- Bathrooms: 6
Appliances
- Included: Dryer
- Laundry: Washer Hookup
Features
- Common walls with other units/homes: 1 Common Wall
Interior area
- Total structure area: 3,512
- Total interior livable area: 3,512 sqft
Property
Features
- Entry location: Front
- Pool features: None
Lot
- Size: 5,104 Square Feet
- Features: 2-5 Units/Acre
Details
- Parcel number: 6023015026
- Special conditions: Standard
Construction
Type & style
- Home type: MultiFamily
- Property subtype: Duplex
- Attached to another structure: Yes
Condition
- New construction: No
- Year built: 2016
Utilities & green energy
- Sewer: Public Sewer
- Water: Public
Community & HOA
Community
- Features: Park
Location
- Region: Los Angeles
Financial & listing details
- Price per square foot: $339/sqft
- Tax assessed value: $799,056
- Date on market: 9/22/2026
- Cumulative days on market: 30 days
- Listing terms: Cash,Conventional,FHA,VA Loan
Estimated market value
$1,183,500
$1.12M - $1.24M
$3,725/mo
Price history
| Date | Event | Price |
|---|---|---|
| 10/15/2026 | Listing removed | $4,200$1/sqft |
Source: Zillow Rentals Report a problem | ||
| 9/23/2026 | Listed for sale | $1,189,000+76.1%$339/sqft |
Source:  CRMLS #DW26205139 Report a problem | ||
| 8/31/2026 | Listed for rent | $4,200+180%$1/sqft |
Source: Zillow Rentals Report a problem | ||
| 8/25/2016 | Sold | $675,000+150%$192/sqft |
Source: Public Record Report a problem | ||
| 2/18/2016 | Listing removed | $270,000$77/sqft |
Source: Century 21 A Better Service #DW16023551 Report a problem | ||
| 2/4/2016 | Pending sale | $270,000$77/sqft |
Source: Century 21 A Better Service #DW16023551 Report a problem | ||
| 2/4/2016 | Listed for sale | $270,000+8%$77/sqft |
Source: Century 21 A Better Service #DW16023551 Report a problem | ||
| 1/7/2016 | Sold | $250,000$71/sqft |
Source: Public Record Report a problem | ||
| 12/17/2015 | Listing removed | $1,500 |
Source: Go Section8 Report a problem | ||
| 10/28/2015 | Listed for rent | $1,500 |
Source: Go Section8 Report a problem | ||
| 8/8/2015 | Listing removed | $1,500 |
Source: Go Section8 Report a problem | ||
| 6/26/2015 | Listed for rent | $1,500 |
Source: Go Section8 Report a problem | ||
| 4/8/2014 | Listing removed | $1,500 |
Source: Go Section8 Report a problem | ||
| 2/16/2014 | Listed for rent | $1,500 |
Source: Go Section8 Report a problem | ||
Public tax history
| Year | Property taxes | Tax assessment |
|---|---|---|
| 2026 | -- | $799,056 +2% |
| 2025 | $9,835 +1.6% | $783,390 +2% |
| 2024 | $9,682 +1.9% | $768,030 +2% |
| 2023 | $9,500 +4.8% | $752,972 +2% |
| 2022 | $9,064 +1.4% | $738,209 +2% |
| 2021 | $8,939 -1% | $723,735 +1% |
| 2020 | $9,025 | $716,315 +2% |
| 2019 | $9,025 +5.4% | $702,270 +2% |
| 2018 | $8,565 | $688,500 +2% |
| 2017 | $8,565 +2.3% | $675,000 +150.7% |
| 2016 | $8,373 +146.7% | $269,200 +1.5% |
| 2015 | $3,394 +0.9% | $265,158 +2% |
| 2014 | $3,365 | $259,965 +9.3% |
| 2012 | -- | $237,900 +5.9% |
| 2011 | -- | $224,600 |
| 2010 | -- | $224,600 |
| 2009 | -- | $224,600 -7.4% |
| 2008 | -- | $242,621 +2% |
| 2007 | -- | $237,865 -7.6% |
| 2006 | -- | $257,550 |
| 2005 | -- | $257,550 +564.3% |
| 2004 | -- | $38,768 +1.9% |
| 2003 | -- | $38,058 +2% |
| 2002 | -- | $37,313 +4% |
| 2000 | -- | $35,866 |
Find assessor info on the county website
Monthly payment
Est. payment
Payment breakdown
Explore the cost of this home by adjusting the details. Changes won't be saved.Climate risks
Neighborhood: Southeast Los Angeles
Similar homes
- $1,195,00010 bd6 ba3.5k sqft710 & 708 E 80th St, Los Angeles, CA 90001For Sale
 MLS ID #OC26161307, Sandra Renshaw, Livel Real Estate. CRMLS
- $1,150,0008 bd6 ba3.5k sqft645 E 78th St, Los Angeles, CA 90001For Sale
 MLS ID #OC26167009, Christopher Audish, HCM Real Estate. CRMLS
- $1,195,00010 bd6 ba3.6k sqft831 W 50th Pl, Los Angeles, CA 90037For Sale
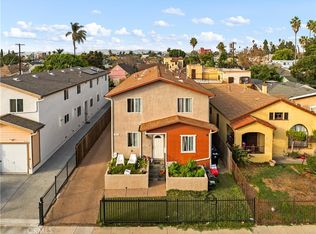 MLS ID #OC26221761, Collin Corsmeier, Balboa Real Estate, Inc. CRMLS
- $1,150,00010 bd6 ba3.3k sqft162 W 65th St, Los Angeles, CA 90003For Sale
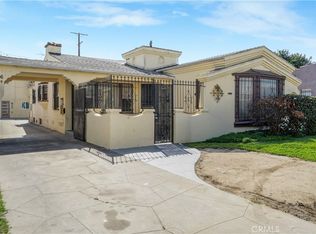 MLS ID #SB26201104, Aaron Jacobson, Lyon Stahl Investment Real Estate, Inc.. CRMLS
