Opportunity Knocks in West Oakland! Prime lot available for sale in vibrant West Oakland, perfectly located close to BART, freeways, and downtown. Take advantage of this rare chance to build your dream duplex with city-approved plans already in place. This booming area offers incredible potential for growth and investment—don't miss out on this fantastic opportunity to invest in one of Oakland's most promising neighborhoods. Contact us today for more information.
Lot/land
$330,000
739 Campbell St, Oakland, CA 94607
--beds
--baths
4,284Square Feet
Unimproved Land
Built in ----
4,284 Square Feet Lot
$-- Zestimate®
$--/sqft
$-- HOA
What's special
- 352 days
- 63
- 1
Zillow last checked:
Listing updated:
Listed by:
David Newton DRE #01966208 510-689-9886,
Coldwell Banker Realty
Source: bridgeMLS/CCAR/Bay East AOR,MLS#: 41117306
Facts & features
Property
Lot
- Size: 4,284 Square Feet
- Features: Level
Details
- Parcel number: 61713
- Zoning: RM2
- Special conditions: Standard
Utilities & green energy
- Sewer: Public Sewer
- Water: Public
- Utilities for property: Other On Site
Community & HOA
HOA
- Has HOA: No
Location
- Region: Oakland
Financial & listing details
- Tax assessed value: $337,374
- Date on market: 11/12/2025
- Listing terms: Cash
Estimated market value
Not available
Estimated sales range
Not available
Not available
Price history
| Date | Event | Price |
|---|---|---|
| 7/8/2026 | Listed for sale | $330,000-5.4% |
Source:  bridgeMLS/CCAR/Bay East AOR #41117306 Report a problem | ||
| 11/13/2025 | Listed for sale | $349,000-6.9% |
Source: bridgeMLS/CCAR/Bay East AOR #41117306 Report a problem | ||
| 8/14/2025 | Listing removed | $375,000 |
Source: bridgeMLS/CCAR/Bay East AOR #41086351 Report a problem | ||
| 2/19/2025 | Listed for sale | $375,000-11.8% |
Source: bridgeMLS/CCAR/Bay East AOR #41086351 Report a problem | ||
| 10/11/2024 | Listing removed | $425,000 |
Source: bridgeMLS/CCAR/Bay East AOR #41049728 Report a problem | ||
| 3/12/2024 | Price change | $425,000-11.3% |
Source: bridgeMLS/CCAR/Bay East AOR #41049728 Report a problem | ||
| 9/15/2023 | Listed for sale | $479,000 |
Source:  SFAR #423743404 Report a problem | ||
| 8/24/2023 | Listing removed | -- |
Source: SFAR #423743404 Report a problem | ||
| 9/26/2022 | Listed for sale | $479,000 |
Source: SFAR #422693050 Report a problem | ||
| 9/6/2022 | Listing removed | -- |
Source: bridgeMLS/CCAR/Bay East AOR #40983739 Report a problem | ||
| 7/5/2022 | Price change | $479,000-4% |
Source: bridgeMLS/CCAR/Bay East AOR #40983739 Report a problem | ||
| 3/7/2022 | Listed for sale | $499,000 |
Source: bridgeMLS/CCAR/Bay East AOR #40983739 Report a problem | ||
| 12/21/2021 | Listing removed | -- |
Source: bridgeMLS/CCAR/Bay East AOR #40961726 Report a problem | ||
| 8/4/2021 | Listed for sale | $499,000 |
Source: bridgeMLS/CCAR/Bay East AOR #40961726 Report a problem | ||
| 6/23/2021 | Listing removed | -- |
Source: bridgeMLS/CCAR/Bay East AOR #40942797 Report a problem | ||
| 3/25/2021 | Listed for sale | $499,000+75.1% |
Source: bridgeMLS/CCAR/Bay East AOR #40942797 Report a problem | ||
| 4/18/2017 | Sold | $285,000 |
Source: bridgeMLS/CCAR/Bay East AOR #40766062 Report a problem | ||
Public tax history
| Year | Property taxes | Tax assessment |
|---|---|---|
| 2026 | -- | $337,374 +2% |
| 2025 | $11,839 +2% | $330,759 +2% |
| 2024 | $11,607 +98.6% | $324,275 +2% |
| 2023 | $5,846 +3.3% | $317,917 +2% |
| 2022 | $5,658 -50% | $311,684 +2% |
| 2021 | $11,321 +115.1% | $305,574 +1% |
| 2020 | $5,263 +5.1% | $302,442 +2% |
| 2019 | $5,008 +402.6% | $296,514 +2% |
| 2018 | $996 | $290,700 +2662.5% |
| 2017 | $996 +16.5% | $10,523 +2% |
| 2016 | $855 +0.7% | $10,317 +1.5% |
| 2015 | $849 +16.3% | $10,162 +2% |
| 2014 | $730 | $9,963 +0.5% |
| 2013 | -- | $9,918 +2% |
| 2012 | -- | $9,724 +2% |
| 2011 | -- | $9,533 +0.8% |
| 2010 | -- | $9,462 -0.2% |
| 2009 | -- | $9,484 +2% |
| 2008 | -- | $9,298 +2% |
| 2007 | -- | $9,116 +2% |
| 2006 | -- | $8,937 +2% |
| 2005 | -- | $8,762 +2% |
| 2004 | -- | $8,591 +1.9% |
| 2003 | -- | $8,433 +2% |
| 2002 | -- | $8,268 +2% |
| 2001 | $357 | $8,106 |
Find assessor info on the county website
Monthly payment
Climate risks
Neighborhood: Prescott


Similar homes
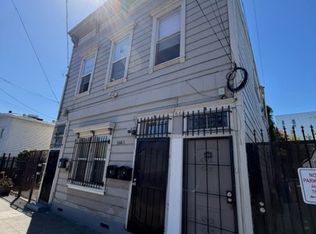
- $330,0002,065 sqft1556 8th St, Oakland, CA 94607Lot/Land
 MLS ID #ML82056263, Bella Shih. MLSListings Inc
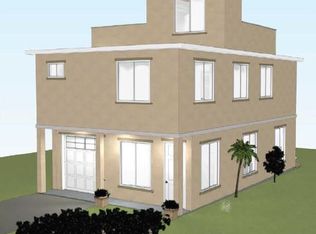
- $168,0002,000 sqft826 Pine St, Oakland, CA 94607Lot/Land
 MLS ID #41144271, Adam Nousomme. bridgeMLS/CCAR/Bay East AOR
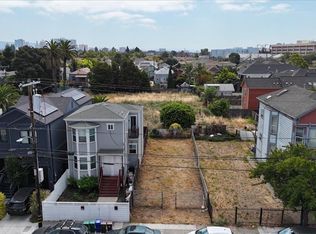
- $428,8800.31 acres661 Macarthur Blvd, Oakland, CA 94610Lot/Land
 MLS ID #ML82058251, Isaac Nada. MLSListings Inc
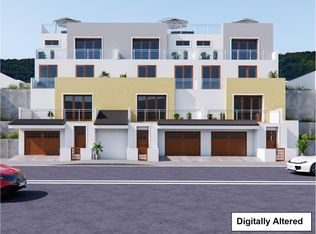
- $355,0006,000 sqft1127 E 20th St, Oakland, CA 94606Lot/Land
 MLS ID #426135241, Nick Flageollet DRE #02093980, Compass. SFAR
Local buyer's agents are ready to help
