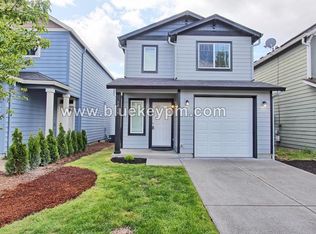
The auction for this Hubzu property ends 09-16-2026 at 12:00 PM ET. Why wait? Bid on this property now. Visit Hubzu to get started. (1) This is a CASH ONLY transaction. (2) Seller to pay Property Taxes, HOA, and Municipal/Utility Liens. All closing costs including transfer taxes are to be paid by the buyer at closing. (3) Please read the Auction disclaimers carefully before placing a bid or submitting an offer. ***
For sale
$275,000
7411 NE 59th St, Vancouver, WA 98662
3beds
3baths
1,479sqft
Single Family Residence
Built in 2008
-- sqft lot
$-- Zestimate®
$186/sqft
$-- HOA
What's special
- 39 days
- 3,983
- 109
Zillow last checked:
Listed by:
NOT APPLICABLE
Source: Hubzu,MLS#: 90617806974AUCN4
Facts & features
Interior
Bedrooms & bathrooms
- Bedrooms: 3
- Bathrooms: 3
Features
- Has basement: No
Interior area
- Total structure area: 1,479
- Total interior livable area: 1,479 sqft
Property
Details
- Parcel number: 104990026
Construction
Type & style
- Home type: SingleFamily
- Property subtype: Single Family Residence
Condition
- Year built: 2008
Community & HOA
Location
- Region: Vancouver
Financial & listing details
- Price per square foot: $186/sqft
- Tax assessed value: $391,334
- Annual tax amount: $3,814
- Date on market: 9/10/2026
- Lease term: Contact For Details
Estimated market value
Not available
Estimated sales range
Not available
$2,282/mo
Price history
| Date | Event | Price |
|---|---|---|
| 10/1/2026 | Pending sale | $249,000-9.5%$168/sqft |
Source: Hubzu Zillow Review #90617806974AUCN5 Report a problem | ||
| 9/10/2026 | Listed for sale | $275,000$186/sqft |
Source:  Hubzu REO #90617806974AUCN4 Report a problem | ||
| 9/9/2026 | Listing removed | $275,000$186/sqft |
Source: Hubzu #90617806974AUCN3 Report a problem | ||
| 9/3/2026 | Listed for sale | $275,000$186/sqft |
Source: Hubzu REO #90617806974AUCN3 Report a problem | ||
| 9/2/2026 | Listing removed | $275,000$186/sqft |
Source: Hubzu #90617806974AUCN2 Report a problem | ||
| 8/27/2026 | Price change | $275,000+12.2%$186/sqft |
Source: Hubzu REO #90617806974AUCN2 Report a problem | ||
| 8/17/2026 | Pending sale | $245,000-10.9%$166/sqft |
Source: Hubzu Zillow Review #90617806974AUCN1 Report a problem | ||
| 8/1/2026 | Listed for sale | $275,000-12.9%$186/sqft |
Source: Hubzu REO #90617806974AUCN1 Report a problem | ||
| 11/16/2020 | Sold | $315,900-2.8%$214/sqft |
Source:  RMLS (OR) #20257029 Report a problem | ||
| 10/3/2020 | Pending sale | $325,000$220/sqft |
Source: Brantley Christianson Real Estate #20257029 Report a problem | ||
| 10/1/2020 | Listed for sale | $325,000+38.3%$220/sqft |
Source: Brantley Christianson Real Estate #20257029 Report a problem | ||
| 11/28/2016 | Sold | $235,000-0.6%$159/sqft |
Source: RMLS (OR) #16390392 Report a problem | ||
| 8/30/2016 | Pending sale | $236,500$160/sqft |
Source: Columbia Tech East Vancouver #16390392 Report a problem | ||
| 8/9/2016 | Listed for sale | $236,500$160/sqft |
Source: Columbia Tech East Vancouver #16390392 Report a problem | ||
| 7/28/2016 | Pending sale | $236,500$160/sqft |
Source: Columbia Tech East Vancouver #16390392 Report a problem | ||
| 7/19/2016 | Listed for sale | $236,500+11.4%$160/sqft |
Source: Columbia Tech East Vancouver #16390392 Report a problem | ||
| 3/11/2016 | Sold | $212,364+6.2%$144/sqft |
Source: Public Record Report a problem | ||
| 2/12/2008 | Sold | $200,000$135/sqft |
Source: Public Record Report a problem | ||
Public tax history
| Year | Property taxes | Tax assessment |
|---|---|---|
| 2025 | $3,814 +4.7% | $391,334 +5.2% |
| 2024 | $3,644 +4.8% | $372,003 +0.5% |
| 2023 | $3,478 +11.1% | $370,329 +1.6% |
| 2022 | $3,130 +14.3% | $364,639 +17% |
| 2021 | $2,739 +9.4% | $311,636 +21.3% |
| 2020 | $2,505 | $256,976 +5.8% |
| 2019 | $2,505 +9% | $242,859 +4.9% |
| 2018 | $2,298 -6.3% | $231,488 +13% |
| 2017 | $2,453 +6% | $204,925 +5.5% |
| 2016 | $2,314 +3.8% | $194,237 +11.9% |
| 2015 | $2,228 +4.1% | $173,584 +10.6% |
| 2014 | $2,140 | $156,889 +11.5% |
| 2013 | $2,140 +5.7% | $140,680 +11.1% |
| 2012 | $2,024 +2.7% | $126,676 -10.9% |
| 2011 | $1,971 +7.4% | $142,134 -1% |
| 2010 | $1,836 -9.3% | $143,570 -3.2% |
| 2009 | $2,025 | $148,336 +92.6% |
| 2008 | -- | $77,000 |
| 2007 | -- | $77,000 |
Find assessor info on the county website