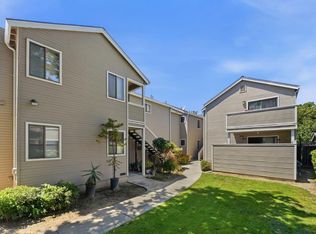
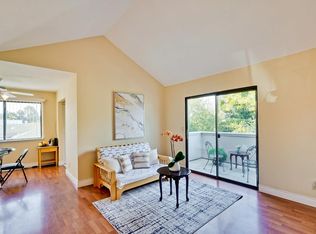
San Jose 95111 caltrain capital
This property is off market, which means it's not currently listed for sale or rent on Zillow. This may be different from what's available on other websites or public sources.
$550,600
$518,000 - $578,000
$3,087/mo
$3,087/mo
Rent Zestimate®
Find your next renter with Zillow Rental Manager. Plus, with online applications, you can quickly screen prospective tenants – for free.
$3,087/mo
Rent Zestimate®
$3,919/mo
Est. payment
Refinancing to a lower rate could help reduce your monthly payments and save thousands over the life of the loan.
$3,919/mo
Est. payment
Work with a Zillow partner agent
Leverage their expertise and Zillow's premium Showcase listings to get your home seen by more buyers.
Get startedList with your own agent
Get your home in front of millions of buyers by listing it on Zillow.
Learn how to do itSell it yourself
Take full control of how buyers see your home on Zillow by listing For Sale by Owner (FSBO).
List your homeSan Jose 95111 caltrain capital
This property is off market, which means it's not currently listed for sale or rent on Zillow. This may be different from what's available on other websites or public sources.
| Date | Event | Price |
|---|---|---|
| 3/11/2022 | Listing removed | -- |
Source: | ||
| 2/25/2022 | Listed for sale | $530,000$564/sqft |
Source: | ||
| 2/22/2022 | Listing removed | -- |
Source: MetroList Services of CA #222004130 Report a problem | ||
| 1/27/2022 | Pending sale | $530,000$564/sqft |
Source: MetroList Services of CA #222004130 Report a problem | ||
| 1/14/2022 | Listed for sale | $530,000$564/sqft |
Source: MetroList Services of CA #222004130 Report a problem | ||
| 1/6/2022 | Listing removed | -- |
Source: MetroList Services of CA Report a problem | ||
| 11/23/2021 | Pending sale | $530,000$564/sqft |
Source: MetroList Services of CA #221141601 Report a problem | ||
| 11/5/2021 | Listed for sale | $530,000-3.6%$564/sqft |
Source: MetroList Services of CA #221141601 Report a problem | ||
| 8/16/2021 | Listing removed | -- |
Source: MetroList Services of CA Report a problem | ||
| 8/13/2021 | Price change | $550,000-8.2%$586/sqft |
Source: MetroList Services of CA #221086234 Report a problem | ||
| 7/16/2021 | Listed for sale | $599,000+21%$638/sqft |
Source: MetroList Services of CA #221086234 Report a problem | ||
| 4/17/2020 | Listing removed | $495,000$527/sqft |
Source: Goodview Financial & Real Estate #ML81781465 Report a problem | ||
| 3/2/2020 | Pending sale | $495,000$527/sqft |
Source: Goodview Financial & Real Estate #ML81781465 Report a problem | ||
| 2/12/2020 | Listed for sale | $495,000+27.6%$527/sqft |
Source: Goodview Financial & Real Estate #ML81781465 Report a problem | ||
| 6/2/2017 | Sold | $388,000+1.3%$413/sqft |
Source: Public Record Report a problem | ||
| 3/9/2017 | Pending sale | $383,000$408/sqft |
Source: Maxreal #ML81640346 Report a problem | ||
| 2/28/2017 | Listed for sale | $383,000+26.8%$408/sqft |
Source: Maxreal #ML81640346 Report a problem | ||
| 7/31/2014 | Sold | $302,000-10.9%$322/sqft |
Source: Public Record Report a problem | ||
| 5/15/2014 | Listed for sale | $338,880+78.4%$361/sqft |
Source: Coldwell Banker Residential Brokerage - Saratoga #81416728 Report a problem | ||
| 10/30/2008 | Sold | $190,000-31.2%$202/sqft |
Source: Public Record Report a problem | ||
| 6/18/2008 | Sold | $276,000+324.6%$294/sqft |
Source: Public Record Report a problem | ||
| 11/28/2005 | Sold | $65,000+766.7%$69/sqft |
Source: Public Record Report a problem | ||
| 6/23/2000 | Sold | $7,500-95.5%$8/sqft |
Source: Public Record Report a problem | ||
| 6/1/1999 | Sold | $165,000$176/sqft |
Source: Public Record Report a problem | ||
| Year | Property taxes | Tax assessment |
|---|---|---|
| 2025 | $6,586 +5.3% | $450,300 +2% |
| 2024 | $6,253 +1.1% | $441,472 +2% |
| 2023 | $6,186 +2.1% | $432,816 +2% |
| 2022 | $6,060 -0.1% | $424,330 +2% |
| 2021 | $6,064 +3% | $416,010 +1% |
| 2020 | $5,888 | $411,746 +2% |
| 2019 | $5,888 +3.8% | $403,674 +2% |
| 2018 | $5,673 | $395,760 +26.5% |
| 2017 | $5,673 +20.7% | $312,736 +2% |
| 2016 | $4,701 +7.6% | $306,604 +1.5% |
| 2015 | $4,369 +49% | $302,000 +51.3% |
| 2014 | $2,932 | $199,588 +0.5% |
| 2013 | -- | $198,686 +11.6% |
| 2012 | -- | $178,000 +11.3% |
| 2011 | -- | $160,000 -2.4% |
| 2010 | -- | $164,000 -13.7% |
| 2009 | -- | $190,000 -37.8% |
| 2008 | -- | $305,500 -14.4% |
| 2007 | -- | $356,745 +2% |
| 2006 | -- | $349,750 +80.8% |
| 2005 | -- | $193,476 +2% |
| 2004 | -- | $189,683 +1.9% |
| 2003 | -- | $186,208 +2% |
| 2002 | -- | $182,558 +2% |
| 2001 | -- | $178,979 |
Find assessor info on the county website