This 960 square foot single family home has 2 bedrooms and 1.0 bathrooms. This home is located at 755 Porter St, Fallbrook, CA 92028.
Pre-foreclosure
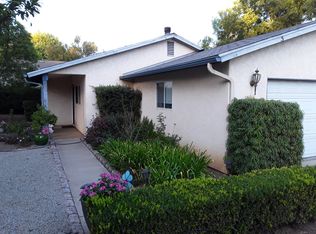
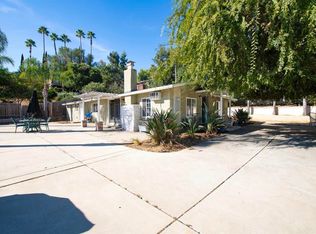
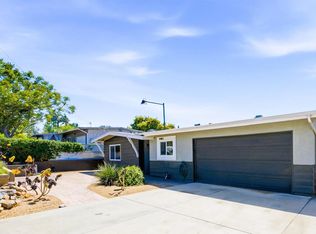
Street View
Est. $638,000
755 Porter St, Fallbrook, CA 92028
2beds
1baths
960sqft
SingleFamily
Built in 1965
0.52 Acres Lot
$638,000 Zestimate®
$665/sqft
$-- HOA
Overview
- 26 days |
- 22 |
- 0 |
Facts & features
Interior
Bedrooms & bathrooms
- Bedrooms: 2
- Bathrooms: 1
Interior area
- Total interior livable area: 960 sqft
Property
Lot
- Size: 0.52 Acres
Details
- Parcel number: 1057102200
Construction
Type & style
- Home type: SingleFamily
Condition
- Year built: 1965
Community & HOA
Location
- Region: Fallbrook
Financial & listing details
- Price per square foot: $665/sqft
- Tax assessed value: $402,484
- Annual tax amount: $4,348
Visit our professional directory to find a foreclosure specialist in your area that can help with your home search.
Find a foreclosure agentForeclosure details
Estimated market value
$638,000
$600,000 - $676,000
$2,880/mo
Price history
| Date | Event | Price |
|---|---|---|
| 6/22/2016 | Sold | $340,000-2.9%$354/sqft |
Source: Public Record Report a problem | ||
| 10/11/2005 | Sold | $350,000$365/sqft |
Source: Public Record Report a problem | ||
Public tax history
| Year | Property taxes | Tax assessment |
|---|---|---|
| 2025 | $4,348 +2.4% | $402,484 +2% |
| 2024 | $4,244 +2.9% | $394,593 +2% |
| 2023 | $4,123 0% | $386,857 +2% |
| 2022 | $4,125 +3.5% | $379,272 +2% |
| 2021 | $3,986 -0.8% | $371,836 +1% |
| 2020 | $4,017 +3% | $368,025 +2% |
| 2019 | $3,900 +0.6% | $360,810 +2% |
| 2018 | $3,878 +2% | $353,736 +2% |
| 2017 | $3,802 +49% | $346,800 +44.5% |
| 2016 | $2,551 +9.4% | $240,000 +9.1% |
| 2015 | $2,332 +10.1% | $220,000 +10% |
| 2014 | $2,118 | $200,000 |
| 2013 | -- | $200,000 |
| 2012 | -- | $200,000 |
| 2011 | -- | $200,000 +25% |
| 2010 | -- | $160,000 |
| 2009 | -- | $160,000 -56.1% |
| 2008 | -- | $364,138 +2% |
| 2007 | -- | $356,999 +2% |
| 2006 | -- | $350,000 +995.1% |
| 2005 | -- | $31,960 +2% |
| 2004 | -- | $31,335 +1.9% |
| 2003 | -- | $30,762 +2% |
| 2002 | -- | $30,160 +2% |
| 2001 | -- | $29,570 |
Find assessor info on the county website
Monthly payment
Estimated monthly payment$1,822
All calculations are estimates and provided by Zillow, Inc. for informational purposes only. Actual amounts may vary.
HOA fees may include property taxes on listings classified as Co-Ops. Contact the listing agent and/or owner for fee details.
Mortgage interest rates are dependent on a number of factors, including credit score, down payment, and repayment length. Interest rate data provided by Zillow Group Marketplace, Inc. as of 1/1/1970 from various mortgage lenders with which we have lead or other similar arrangements; the Estimated Payment is an average of those rates.
See how much you could borrow to make a competitive offer.
Climate risks
Neighborhood: 92028
Nearby schools
GreatSchools rating
- 5/10Fallbrook Street Elementary SchoolGrades: K-6Distance: 1.1 mi
- 5/10James E. Potter Intermediate SchoolGrades: 7-8Distance: 1.9 mi
- 6/10Fallbrook High SchoolGrades: 9-12Distance: 2.8 mi


- California
- San Diego County
- Fallbrook
- 92028
- 755 Porter St
Nearby cities
Nearby zip codes
Other Fallbrook Topics
