This 1120 square foot single family home has 3 bedrooms and 1.0 bathrooms. This home is located at 755 Rees Ct, Longmont, CO 80504.
Pre-foreclosure
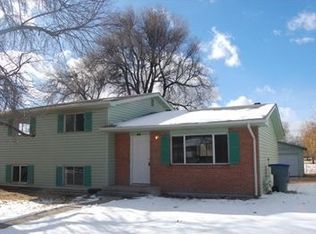
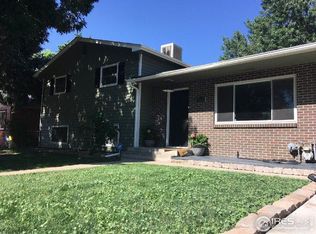
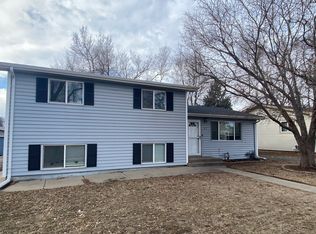
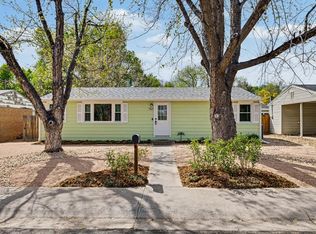
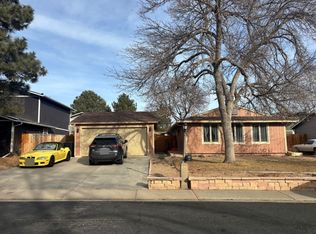
Street View
Est. $389,700
755 Rees Ct, Longmont, CO 80504
3beds
1baths
1,120sqft
SingleFamily
Built in 1966
8,886 Square Feet Lot
$389,700 Zestimate®
$348/sqft
$-- HOA
Overview
- 351 days |
- 14 |
- 0 |
Facts & features
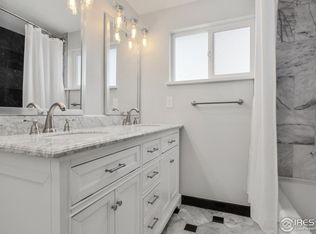
Interior
Bedrooms & bathrooms
- Bedrooms: 3
- Bathrooms: 1
Heating
- Forced air
Interior area
- Total interior livable area: 1,120 sqft
Property
Parking
- Parking features: Carport, Garage
Features
- Exterior features: Shingle, Wood
Lot
- Size: 8,886 Square Feet
Details
- Parcel number: 131502207005
Construction
Type & style
- Home type: SingleFamily
Materials
- Frame
Condition
- Year built: 1966
Community & HOA
Location
- Region: Longmont
Financial & listing details
- Price per square foot: $348/sqft
- Tax assessed value: $377,400
- Annual tax amount: $2,037
Visit our professional directory to find a foreclosure specialist in your area that can help with your home search.
Find a foreclosure agentForeclosure details
Estimated market value
$389,700
$359,000 - $417,000
$2,296/mo
Price history
| Date | Event | Price |
|---|---|---|
| 6/18/1997 | Sold | $96,000$86/sqft |
Source: Public Record Report a problem | ||
Public tax history
| Year | Property taxes | Tax assessment |
|---|---|---|
| 2025 | $2,037 +1.4% | $23,588 -5.6% |
| 2024 | $2,009 +5.2% | $24,977 -1% |
| 2023 | $1,909 -1.3% | $25,220 +30.7% |
| 2022 | $1,934 +18.9% | $19,293 -2.8% |
| 2021 | $1,627 | $19,848 +18.5% |
| 2020 | $1,627 +14.4% | $16,746 |
| 2019 | $1,422 | $16,746 +11.9% |
| 2018 | $1,422 | $14,969 -9.5% |
| 2017 | $1,422 +19.4% | $16,549 +32.8% |
| 2016 | $1,191 +4.9% | $12,457 +35.6% |
| 2015 | $1,135 +32.2% | $9,186 |
| 2014 | $858 -19.3% | $9,186 |
| 2013 | $1,063 +6.8% | $9,186 -19.9% |
| 2012 | $996 -0.1% | $11,463 |
| 2011 | $997 +1.8% | -- |
| 2010 | $979 -15.9% | $11,580 |
| 2009 | $1,164 +12.1% | $11,580 -27.4% |
| 2008 | $1,038 +10.1% | $15,940 |
| 2007 | $943 -1.8% | $15,940 +10.5% |
| 2006 | $960 -1.3% | $14,430 |
| 2005 | $972 +1.2% | $14,430 -1.8% |
| 2004 | $961 +1.4% | $14,700 |
| 2003 | $948 +10.5% | $14,700 +17.5% |
| 2002 | $858 | $12,510 -90.8% |
| 2001 | -- | $136,700 |
Find assessor info on the county website
Monthly payment
Estimated monthly payment$1,822
All calculations are estimates and provided by Zillow, Inc. for informational purposes only. Actual amounts may vary.
HOA fees may include property taxes on listings classified as Co-Ops. Contact the listing agent and/or owner for fee details.
Mortgage interest rates are dependent on a number of factors, including credit score, down payment, and repayment length. Interest rate data provided by Zillow Group Marketplace, Inc. as of 1/1/1970 from various mortgage lenders with which we have lead or other similar arrangements; the Estimated Payment is an average of those rates.
See how much you could borrow to make a competitive offer.
Climate risks
Neighborhood: Kensington
Nearby schools
GreatSchools rating
- 5/10Columbine Elementary SchoolGrades: PK-5Distance: 0.3 mi
- 4/10Trail Ridge Middle SchoolGrades: 6-8Distance: 1.7 mi
- 3/10Skyline High SchoolGrades: 9-12Distance: 0.9 mi


Nearby cities
Nearby neighborhoods
Nearby zip codes
Other Longmont Topics
