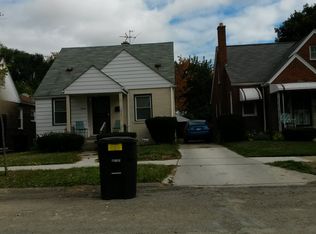
Appliance not included
This property is off market, which means it's not currently listed for sale or rent on Zillow. This may be different from what's available on other websites or public sources.
$63,500
$50,000 - $78,000
$1,300/mo
$1,300/mo
Rent Zestimate®
Find your next renter with Zillow Rental Manager. Plus, with online applications, you can quickly screen prospective tenants – for free.
$1,300/mo
Rent Zestimate®
$365/mo
Est. payment
Refinancing to a lower rate could help reduce your monthly payments and save thousands over the life of the loan.
$365/mo
Est. payment
Work with a Zillow partner agent
Leverage their expertise and Zillow's premium Showcase listings to get your home seen by more buyers.
Get startedList with your own agent
Get your home in front of millions of buyers by listing it on Zillow.
Learn how to do itSell it yourself
Take full control of how buyers see your home on Zillow by listing For Sale by Owner (FSBO).
List your homeAppliance not included
This property is off market, which means it's not currently listed for sale or rent on Zillow. This may be different from what's available on other websites or public sources.
| Date | Event | Price |
|---|---|---|
| 6/3/2022 | Listing removed | -- |
Source: Zillow Rental Manager Report a problem | ||
| 5/3/2022 | Listed for rent | $1,000+37.9%$1/sqft |
Source: Zillow Rental Manager Report a problem | ||
| 9/8/2021 | Listing removed | -- |
Source: | ||
| 9/2/2021 | Listed for sale | $69,900+163.8%$78/sqft |
Source: | ||
| 7/29/2020 | Sold | $26,500-18.5%$30/sqft |
Source: Agent Provided Report a problem | ||
| 4/4/2020 | Price change | $32,500-6.9%$36/sqft |
Source: Detroit Investment Company #2200016344 Report a problem | ||
| 2/28/2020 | Price change | $34,900-2.8%$39/sqft |
Source: Detroit Investment Company #2200016344 Report a problem | ||
| 2/11/2020 | Listed for sale | $35,900$40/sqft |
Source: Detroit Investment Company #219049746 Report a problem | ||
| 2/11/2020 | Pending sale | $35,900$40/sqft |
Source: Detroit Investment Company #219049746 Report a problem | ||
| 1/15/2020 | Price change | $35,900-7.7%$40/sqft |
Source: Detroit Investment Company #219049746 Report a problem | ||
| 11/20/2019 | Price change | $38,900-7.2%$43/sqft |
Source: Detroit Investment Company #219049746 Report a problem | ||
| 5/28/2019 | Listed for sale | $41,900-5.1%$47/sqft |
Source: Detroit Investment Company #219049746 Report a problem | ||
| 8/29/2018 | Listing removed | $725$1/sqft |
Source: Metro Detroit Property Management Report a problem | ||
| 5/31/2018 | Price change | $725-3.3%$1/sqft |
Source: MDPM Report a problem | ||
| 5/16/2018 | Listed for rent | $750+3.4%$1/sqft |
Source: MDPM Report a problem | ||
| 9/1/2015 | Sold | $44,175+47.3%$49/sqft |
Source: Public Record Report a problem | ||
| 4/16/2014 | Listing removed | $725$1/sqft |
Source: RE/MAX Leading Edge #214003918 Report a problem | ||
| 1/16/2014 | Listed for rent | $725+3.6%$1/sqft |
Source: RE/MAX LEADING EDGE #214003918 Report a problem | ||
| 2/27/2013 | Listing removed | $700-6.7%$1/sqft |
Source: Grh Report a problem | ||
| 12/4/2012 | Price change | $750+7.1%$1/sqft |
Source: Mutual Property 2 Report a problem | ||
| 11/13/2012 | Price change | $700-6.7%$1/sqft |
Source: Grh Report a problem | ||
| 10/6/2012 | Price change | $750+7.1%$1/sqft |
Source: Mutual Property 2 Report a problem | ||
| 8/23/2012 | Listed for rent | $700$1/sqft |
Source: Mutual Property 2 Report a problem | ||
| 6/29/2010 | Sold | $30,000-56.5%$33/sqft |
Source: Public Record Report a problem | ||
| 3/10/2008 | Sold | $68,987$77/sqft |
Source: Public Record Report a problem | ||
| Year | Property taxes | Tax assessment |
|---|---|---|
| 2025 | -- | $27,200 +28.3% |
| 2024 | -- | $21,200 +20.5% |
| 2023 | -- | $17,600 +31.3% |
| 2022 | -- | $13,400 +7.2% |
| 2021 | -- | $12,500 |
| 2020 | $937 +52.7% | $12,500 +14.7% |
| 2019 | $614 | $10,900 +3.8% |
| 2018 | $614 | $10,500 -2.8% |
| 2017 | -- | $10,800 +47.9% |
| 2016 | $2,124 | $7,300 |
| 2015 | $2,124 +87.6% | $7,300 -62.1% |
| 2013 | $1,132 -46.7% | $19,236 -31.8% |
| 2010 | $2,124 | $28,202 -18% |
| 2009 | -- | $34,393 -14% |
| 2008 | -- | $39,992 |
| 2007 | -- | $39,992 +5.5% |
| 2005 | $216 | $37,907 +3% |
| 2004 | -- | $36,803 +128.3% |
| 2001 | $1,049 +12.2% | $16,118 +3.2% |
| 2000 | $935 | $15,618 |
Find assessor info on the county website
Source: The MLS. This data may not be complete. We recommend contacting the local school district to confirm school assignments for this home.