Buyer did not perform! No home inspection done. FHA appraisal in hand over contract sales price.
Ready to welcome you! Being offered with a 1 year CINCH home warranty to get new owner started! Fresh cape cod with 3 finished levels! First floor has hardwoods; living room and 1 bedroom are exposed, other bedroom has carpet down, but corner turned back so you can see hardwoods. Bath was recently updated with Bath Fitter in 2021! Kitchen provides lots of cabinetry, to include pantry tower and island with 3 deep, spacious drawers accented by granite countertops! From your kitchen, out through the slider, enjoy your deck overlooking the fenced back yard. Lower walk out level provides entertaining options with 2nd kitchen area as well as stadium style riser theater/gaming room! Walk out from this level to your vinyl privacy fenced back yard. Upper level provides 3rd bedroom along with long walk in closet and possible office area.
Foreclosed
Est. $332,700
7739 Overhill Rd, Glen Burnie, MD 21060
3beds
1,092sqft
SingleFamily
Built in 1940
4,356 Square Feet Lot
$332,700 Zestimate®
$305/sqft
$-- HOA
Overview
- 25 days
- 39
- 1
Facts & features
Interior
Bedrooms & bathrooms
- Bedrooms: 3
- Bathrooms: 1
- Full bathrooms: 1
Heating
- Other
Features
- Basement: Finished
- Has fireplace: Yes
Interior area
- Total interior livable area: 1,092 sqft
Property
Features
- Exterior features: Other
Lot
- Size: 4,356 Square Feet
Details
- Parcel number: 0353517022600
Construction
Type & style
- Home type: SingleFamily
- Architectural style: Conventional
Materials
- Roof: Shake / Shingle
Condition
- Year built: 1940
Community & HOA
Location
- Region: Glen Burnie
Financial & listing details
- Price per square foot: $305/sqft
- Tax assessed value: $276,567
- Annual tax amount: $3,554
Foreclosure details
Estimated market value
$332,700
$309,000 - $349,000
$2,224/mo
Price history
| Date | Event | Price |
|---|---|---|
| 10/16/2026 | Sold | $258,874-13.7%$237/sqft |
Source: Public Record Report a problem | ||
| 4/15/2026 | Listing removed | $299,900$275/sqft |
Source:  Bright MLS #MDAA2105560 Report a problem | ||
| 1/6/2026 | Pending sale | $299,900$275/sqft |
Source: Bright MLS #MDAA2105560 Report a problem | ||
| 1/5/2026 | Listing removed | $299,900$275/sqft |
Source: Bright MLS #MDAA2105560 Report a problem | ||
| 12/23/2025 | Listed for sale | $299,900$275/sqft |
Source: Bright MLS #MDAA2105560 Report a problem | ||
| 10/28/2025 | Pending sale | $299,900$275/sqft |
Source: Bright MLS #MDAA2105560 Report a problem | ||
| 10/10/2025 | Contingent | $299,900$275/sqft |
Source: Bright MLS #MDAA2105560 Report a problem | ||
| 10/4/2025 | Listed for sale | $299,900$275/sqft |
Source: Bright MLS #MDAA2105560 Report a problem | ||
| 8/10/2025 | Pending sale | $299,900$275/sqft |
Source: Bright MLS #MDAA2105560 Report a problem | ||
| 7/14/2025 | Contingent | $299,900$275/sqft |
Source: Bright MLS #MDAA2105560 Report a problem | ||
| 7/14/2025 | Listed for sale | $299,900$275/sqft |
Source: Bright MLS #MDAA2105560 Report a problem | ||
| 6/4/2025 | Contingent | $299,900$275/sqft |
Source: Bright MLS #MDAA2105560 Report a problem | ||
| 6/4/2025 | Listed for sale | $299,900$275/sqft |
Source: Bright MLS #MDAA2105560 Report a problem | ||
| 5/13/2025 | Listing removed | $299,900$275/sqft |
Source: Bright MLS #MDAA2105560 Report a problem | ||
| 4/8/2025 | Pending sale | $299,900$275/sqft |
Source: Bright MLS #MDAA2105560 Report a problem | ||
| 3/5/2025 | Contingent | $299,900$275/sqft |
Source: Bright MLS #MDAA2105560 Report a problem | ||
| 3/5/2025 | Listing removed | $299,900$275/sqft |
Source: Bright MLS #MDAA2105560 Report a problem | ||
| 3/2/2025 | Listed for sale | $299,900-4.8%$275/sqft |
Source: Bright MLS #MDAA2105560 Report a problem | ||
| 11/4/2022 | Sold | $315,000+1.6%$288/sqft |
Source: Bright MLS #MDAA2041286 Report a problem | ||
| 10/6/2022 | Pending sale | $310,000$284/sqft |
Source: Bright MLS #MDAA2041286 Report a problem | ||
| 10/2/2022 | Price change | $310,000-2.4%$284/sqft |
Source: Bright MLS #MDAA2041286 Report a problem | ||
| 9/12/2022 | Pending sale | $317,500$291/sqft |
Source: Bright MLS #MDAA2041286 Report a problem | ||
| 8/25/2022 | Price change | $317,500-2.3%$291/sqft |
Source: Bright MLS #MDAA2041286 Report a problem | ||
| 8/12/2022 | Price change | $325,000-1.5%$298/sqft |
Source: Bright MLS #MDAA2041286 Report a problem | ||
| 7/31/2022 | Listed for sale | $330,000+71.4%$302/sqft |
Source: Bright MLS #MDAA2041286 Report a problem | ||
| 3/28/2011 | Sold | $192,500$176/sqft |
Source: Public Record Report a problem | ||
Public tax history
| Year | Property taxes | Tax assessment |
|---|---|---|
| 2026 | $3,554 +6.5% | $276,567 +7.1% |
| 2025 | $3,337 +35.4% | $258,300 +14.8% |
| 2024 | $2,464 +17.7% | $225,033 +17.3% |
| 2023 | $2,094 +26.4% | $191,767 +21% |
| 2022 | $1,656 +4.2% | $158,500 +4.2% |
| 2021 | $1,589 +4.3% | $152,100 +4.4% |
| 2020 | $1,524 +4.5% | $145,700 +4.6% |
| 2019 | $1,458 +3.3% | $139,300 |
| 2018 | $1,413 -0.5% | $139,300 |
| 2017 | $1,420 | $139,300 -3.3% |
| 2016 | -- | $144,100 +5.3% |
| 2015 | -- | $136,833 +5.6% |
| 2014 | -- | $129,567 +5.9% |
| 2013 | -- | $122,300 |
| 2012 | -- | $122,300 |
| 2011 | -- | $122,300 -35.9% |
| 2010 | -- | $190,650 +2.9% |
| 2009 | -- | $185,290 +6.4% |
| 2008 | -- | $174,180 +6.8% |
| 2007 | -- | $163,070 +15.7% |
| 2006 | -- | $140,946 +18.6% |
| 2005 | -- | $118,823 +22.9% |
| 2004 | -- | $96,700 +9.2% |
| 2003 | -- | $88,522 +10.2% |
| 2002 | -- | $80,346 +11.3% |
| 2001 | -- | $72,170 |
Find assessor info on the county website
Monthly payment
Climate risks
Neighborhood: 21060
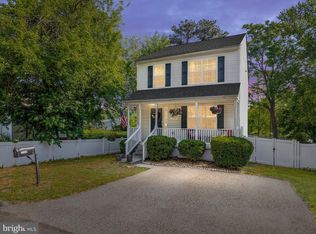
Similar homes
- $309,9002 bd2 ba852 sqft720 210th St, Pasadena, MD 21122For Sale
 MLS ID #MDAA2160858, Diana Klein, Lawyer's Realty, LLC. Bright MLS
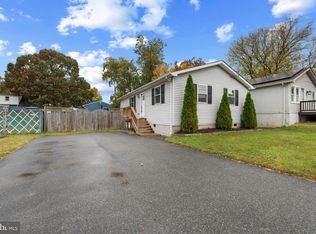
- $--3 bd1 ba1.1k sqft8394 Carol Dr, Pasadena, MD 21122Auction
 Auction.com 1
- $--3 bd2 ba1.5k sqft8610 Willow Oak Rd, Parkville, MD 21234Auction
 Auction.com 2
- $--3 bd1 ba1.1k sqft214 Detroit Ave, Baltimore, MD 21222Auction
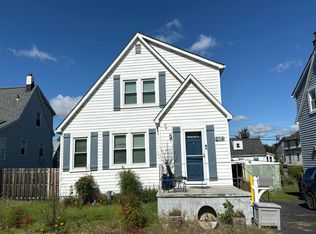 Auction.com 2
- $324,9004 bd1 ba1.2k sqft3451 Yardley Dr, Baltimore, MD 21222For SaleMLS ID #MDBC2178050, Francesca Maragos Carela, American Dream Realty and Management. Bright MLS
- $355,0003 bd2 ba1.4k sqft319 Essex Sq, Essex, MD 21221For SaleMLS ID #MDBC2180510, Jeanette Grace, Real Estate Professionals, Inc.. Bright MLS
- $299,9003 bd2 ba1.1k sqft7415 Hill Ct, Dundalk, MD 21222For SaleMLS ID #MDBC2161998, Andrew Undem, Berkshire Hathaway HomeServices Homesale Realty. Bright MLS
