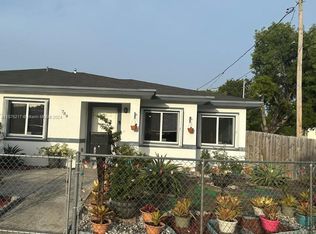
Fully renovated 3/2, completely PERMITTED for peace of mind in 2026, on a fenced lot on a quiet residential street just west of the Design District. All major systems are updated: New roof, windows, electrical, and plumbing. The kitchen features Samsung black stainless steel appliances, plus in-home laundry and a smart water heater. Renovated from the ceiling with linear diffusers to the ground with Spanish Roca ceramics. Spa-like bathrooms with double sinks. Private gated parking with a never-used driveway. A handful of minutes to the Design District, Wynwood, Midtown, and Downtown SoBe, with quick access to I-195, MIA Airport, and the Inter Miami Stadium. Move-in ready.
For sale
Price cut: $29.1K (11/8)
$549,900
775 NW 50th St, Miami, FL 33127
3beds
1,212sqft
Single Family Residence
Built in 1939
5,400 Square Feet Lot
$552,600 Zestimate®
$454/sqft
$-- HOA
What's special
- 10 hours
- 110
- 10
Zillow last checked:
Listing updated:
Listed by:
Jose Safdie 305-399-8241,
Beachfront Realty Inc
Source: MIAMI,MLS#: A12120099 Originating MLS: A-Miami Association of REALTORS
Facts & features
Interior
Bedrooms & bathrooms
- Bedrooms: 3
- Bathrooms: 2
- Full bathrooms: 2
Heating
- Electric
Cooling
- Central Air
Appliances
- Included: Dishwasher, Disposal, Dryer, Electric Range, Electric Water Heater, Ice Maker, Microwave, Refrigerator, Self Cleaning Oven, Washer
Features
- Other
- Flooring: Ceramic Tile
- Windows: Clear Impact Glass
Interior area
- Total structure area: 1,212
- Total interior livable area: 1,212 sqft
Video & virtual tour
Property
Parking
- Parking features: Driveway
- Has uncovered spaces: Yes
Features
- Entry location: First Floor Entry
- Patio & porch: Open Porch
- Pool features: R30-No Pool/No Water
- Fencing: Fenced
- Has view: Yes
- View description: Garden
Lot
- Size: 5,400 Square Feet
- Features: Less Than 1/4 Acre Lot
Details
- Parcel number: 0131230060620
- Zoning: 0100
Construction
Type & style
- Home type: SingleFamily
- Property subtype: Single Family Residence
Materials
- Frame With Stucco
- Roof: Shingle
Condition
- Updated/Remodeled,Completely Renovated
- Year built: 1939
Utilities & green energy
- Electric: Circuit Breakers
- Sewer: Public Sewer
- Water: Municipal Water
Green energy
- Energy efficient items: Appliances, Doors, Water Heater
Community & HOA
Community
- Features: Additional Amenities
- Security: Smoke Detector
- Subdivision: Bowling Green
HOA
- Has HOA: No
Location
- Region: Miami
Financial & listing details
- Price per square foot: $454/sqft
- Tax assessed value: $312,443
- Annual tax amount: $5,579
- Date on market: 11/8/2026
- Listing terms: All Cash,Conventional
Estimated market value
$552,600
$525,000 - $580,000
$3,953/mo
Price history
| Date | Event | Price |
|---|---|---|
| 11/8/2026 | Price change | $549,900-5%$454/sqft |
Source:  MIAMI #A12120099 Report a problem | ||
| 11/4/2026 | Listed for sale | $579,000+581.2%$478/sqft |
Source: MIAMI #A12114822 Report a problem | ||
| 10/21/2026 | Listed for rent | $3,495-4.2%$3/sqft |
Source: MIAMI #A12110413 Report a problem | ||
| 12/31/2024 | Listing removed | $3,650$3/sqft |
Source: MIAMI #A11688951 Report a problem | ||
| 12/7/2024 | Listed for rent | $3,650$3/sqft |
Source: MIAMI #A11688951 Report a problem | ||
| 11/23/2024 | Listing removed | $3,650$3/sqft |
Source: MIAMI #A11688951 Report a problem | ||
| 11/6/2024 | Listed for rent | $3,650+4.9%$3/sqft |
Source: MIAMI #A11688951 Report a problem | ||
| 1/19/2024 | Listing removed | -- |
Source: MIAMI #A11507903 Report a problem | ||
| 1/3/2024 | Listed for rent | $3,480-0.2%$3/sqft |
Source: MIAMI #A11507903 Report a problem | ||
| 12/18/2023 | Listing removed | -- |
Source: MIAMI #A11466033 Report a problem | ||
| 10/10/2023 | Listed for rent | $3,488-11.2%$3/sqft |
Source: MIAMI #A11466033 Report a problem | ||
| 10/9/2023 | Listing removed | -- |
Source: MIAMI #A11459850 Report a problem | ||
| 9/27/2023 | Listed for rent | $3,926-20.7%$3/sqft |
Source: MIAMI #A11459850 Report a problem | ||
| 4/30/2023 | Listing removed | -- |
Source: MIAMI #A11373706 Report a problem | ||
| 4/18/2023 | Listed for rent | $4,950$4/sqft |
Source: MIAMI #A11373706 Report a problem | ||
| 5/7/2019 | Sold | $85,000$70/sqft |
Source: Public Record Report a problem | ||
Public tax history
| Year | Property taxes | Tax assessment |
|---|---|---|
| 2025 | $5,579 +5.2% | $234,113 +10% |
| 2024 | $5,303 +9.8% | $212,830 +10% |
| 2023 | $4,832 +20.1% | $193,482 +19.3% |
| 2022 | $4,024 +11% | $162,221 +10% |
| 2021 | $3,626 +12.1% | $147,474 +10% |
| 2020 | $3,235 +482.7% | $134,068 +303.7% |
| 2019 | $555 +3% | $33,211 +1.9% |
| 2018 | $539 | $32,592 +2.1% |
| 2017 | $539 +2.4% | $31,922 +2.1% |
| 2016 | $527 +2.4% | $31,266 +0.7% |
| 2015 | $514 +0.6% | $31,049 +0.8% |
| 2014 | $512 +3.6% | $30,803 +1.5% |
| 2013 | $494 | $30,348 +1% |
| 2012 | $494 +29.9% | $30,036 +29.5% |
| 2011 | $380 | $23,185 +1.5% |
| 2010 | $380 +4.1% | $22,843 +2.7% |
| 2009 | $365 +12.3% | $22,243 +3.1% |
| 2007 | $325 -12.4% | $21,574 |
| 2006 | $371 | -- |
| 2005 | $371 -3.9% | -- |
| 2004 | $386 | -- |
| 2003 | $386 -39.2% | -- |
| 2002 | $635 | -- |
| 2001 | $635 | -- |
Find assessor info on the county website
Monthly payment
Est. payment
Payment breakdown
Explore the cost of this home by adjusting the details. Changes won't be saved.Climate risks
Neighborhood: Liberty City


Similar homes
- $625,0004 bd2 ba1.3k sqftEden Park, Miami, FL 33127For Sale

 MLS ID #A11912658, Clifford Harris, AMEC Realty & Investment. MIAMI
- $505,0003 bd2 ba1.2k sqft2nd, Miami, FL 33150For Sale
 MLS ID #A12112727, Jose Anzola, Compass Florida, LLC. MIAMI
- $600,0005 bd2 ba1.4k sqftAllapattah View, Miami, FL 33142For Sale
 MLS ID #A11969960, Barclay Belizaire, Keller Williams Eagle Realty. MIAMI
- $560,0002 bd2 ba1.1k sqftMc Call Park, Miami, FL 33142For Sale
 MLS ID #A12058211, Jibelsa Unzalu, United Realty Group Inc. MIAMI
- $540,0004 bd2 ba1.2k sqftFairmont, Miami, FL 33167For SaleMLS ID #A12090226, Vladimir Guia Robaina, Realty One Group Evolution. MIAMI
- $560,0003 bd2 ba1.7k sqftLakeside Manor, Miami, FL 33167For SaleMLS ID #A12069170, Andres Concha, LZ Realty Inc. MIAMI
- $650,0003 bd2 ba1k sqftDouglas Park, Miami, FL 33125For SaleMLS ID #A12108475, Tatiana Ventoso, Rockstar International Realty. MIAMI
- $594,9994 bd3 ba1.3k sqftNichols Golf Estates, Miami, FL 33167For SaleMLS ID #A12088012, Dania Perez, Vera Vita RE. MIAMI
- $545,0002 bd2 ba1k sqftFulford By The Sea Sec J, North Miami Beach, FL 33162For SaleMLS ID #A12083170, Carmen Bohorquez Patino, Keller Williams Realty International Lifestyles. MIAMI
- $495,0003 bd2 ba1.1k sqftJudy Manors, North Miami Beach, FL 33162For SaleMLS ID #A12102804, Julia Poliadis, One Sotheby's International Realty. MIAMI
- $710,0004 bd2 ba1.5k sqftLincoln Park, Miami, FL 33127For SaleMLS ID #A12085953, Carina Burguete, La Rosa Realty LLC. MIAMI
- $549,9003 bd2 ba1.4k sqftBoulevard Heights Sec 12, Pembroke Pines, FL 33024For SaleMLS ID #A12055852, Mildred Rodriguez, United Realty Group Inc.. MIAMI
- $534,9003 bd2 ba1k sqftBelmar Amended, Hollywood, FL 33020For SaleMLS ID #A12073601, Maria Agudelo, United Realty Group Inc. MIAMI
- $800,0004 bd2 ba1.4k sqftLe Jeune Manors, Miami, FL 33126For SaleMLS ID #A12107797, Arianna Triana Arias, Volante Realty Group LLC. MIAMI
- $797,0003 bd2 ba1.3k sqftRevision Of Kenilworth, Miami, FL 33135For SaleMLS ID #A12084869, Carina Burguete, La Rosa Realty LLC. MIAMI
- $505,0002 bd2 ba1k sqftRainbow Park, Miami Gardens, FL 33054For SaleMLS ID #A12104280, Antonio Omedas, Avanti Way Realty LLC. MIAMI
- $519,9853 bd2 ba900 sqftPlayland Estates Sec 2, Hollywood, FL 33021For SaleMLS ID #A12108759, Karen Guzik, WRA Business & Real Estate. MIAMI
- $543,0004 bd2 ba1.1k sqftWilkes-Barre Park, Hollywood, FL 33020For SaleMLS ID #A12075119, Alexandra Jordan, Bellisimo Realty, LLC. MIAMI
- $545,0003 bd2 ba1.3k sqftLandmark At Doral, Doral, FL 33178For SaleMLS ID #A12114672, Victor Oliver, Signature Miami Real Estate LLC. MIAMI
- $750,0002 bd1 ba1.1k sqftOaklawn Sub, Miami, FL 33155For SaleMLS ID #A12049730, Lazara Cruz-Casanova, Casanova International Realty. MIAMI
