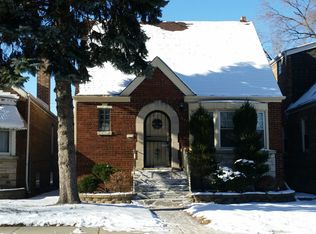
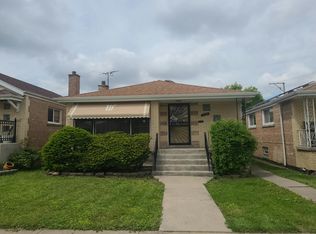
This 1224 square foot single family home has 3 bedrooms and 2.0 bathrooms. This home is located at 7948 S Maplewood Ave, Chicago, IL 60652.
Foreclosed
Est. $317,600
7948 S Maplewood Ave, Chicago, IL 60652
3beds
1,224sqft
SingleFamily
Built in 1952
3,484 Square Feet Lot
$317,600 Zestimate®
$259/sqft
$-- HOA
Overview
- 354 days |
- 29 |
- 1 |
Facts & features
Interior
Bedrooms & bathrooms
- Bedrooms: 3
- Bathrooms: 2
- Full bathrooms: 2
Heating
- Forced air, Gas
Cooling
- Central
Appliances
- Included: Dishwasher, Microwave, Range / Oven, Refrigerator
Features
- Flooring: Tile, Carpet, Hardwood
- Basement: Finished
- Has fireplace: Yes
Interior area
- Total interior livable area: 1,224 sqft
Property
Parking
- Parking features: Garage - Attached
Features
- Exterior features: Brick
Lot
- Size: 3,484 Square Feet
Details
- Parcel number: 1936204030
Construction
Type & style
- Home type: SingleFamily
Materials
- Roof: Asphalt
Condition
- Year built: 1952
Community & HOA
Location
- Region: Chicago
Financial & listing details
- Price per square foot: $259/sqft
- Tax assessed value: $190,000
Visit our professional directory to find a foreclosure specialist in your area that can help with your home search.
Find a foreclosure agentForeclosure details
Estimated market value
$317,600
$302,000 - $333,000
$2,703/mo
Price history
| Date | Event | Price |
|---|---|---|
| 9/3/2021 | Sold | $260,000+6.1%$212/sqft |
Source: | ||
| 7/21/2021 | Pending sale | $245,000$200/sqft |
Source: | ||
| 7/13/2021 | Listed for sale | $245,000+33.2%$200/sqft |
Source: | ||
| 5/5/2017 | Sold | $184,000-1.3%$150/sqft |
Source: | ||
| 3/16/2017 | Pending sale | $186,500$152/sqft |
Source: American International Realty #09512545 Report a problem | ||
| 2/27/2017 | Price change | $186,500-0.2%$152/sqft |
Source: American International Realty #09512545 Report a problem | ||
| 12/22/2016 | Pending sale | $186,800$153/sqft |
Source: American International Realty #09349406 Report a problem | ||
| 11/30/2016 | Listed for sale | $186,800$153/sqft |
Source: American International Realty #09349406 Report a problem | ||
| 11/22/2016 | Pending sale | $186,800$153/sqft |
Source: American International Realty #09349406 Report a problem | ||
| 10/19/2016 | Price change | $186,800-1.6%$153/sqft |
Source: American International Realty #09349406 Report a problem | ||
| 9/22/2016 | Listed for sale | $189,900+165.6%$155/sqft |
Source: American International Realty #09349406 Report a problem | ||
| 7/14/2016 | Sold | $71,500+4.1%$58/sqft |
Source: Public Record Report a problem | ||
| 5/21/2016 | Price change | -- |
Source: Owners.com #09223515 Report a problem | ||
| 5/13/2016 | Listed for sale | $68,700$56/sqft |
Source: REALHome Services and Solutions #09223515 Report a problem | ||
Public tax history
| Year | Property taxes | Tax assessment |
|---|---|---|
| 2024 | -- | $19,000 +5.6% |
| 2023 | $3,826 +2.6% | $18,000 |
| 2022 | $3,731 +25.5% | $18,000 |
| 2021 | $2,973 +18.4% | $18,000 +26.1% |
| 2020 | $2,511 -0.3% | $14,275 -10% |
| 2019 | $2,519 +1.7% | $15,862 |
| 2018 | $2,476 -10.8% | $15,862 +24.2% |
| 2017 | $2,775 +33.6% | $12,775 |
| 2016 | $2,077 +10.6% | $12,775 |
| 2015 | $1,878 -15.6% | $12,775 -11.5% |
| 2014 | $2,225 +2.5% | $14,440 |
| 2013 | $2,170 +0.2% | $14,440 |
| 2012 | $2,166 +3.9% | $14,440 -12.7% |
| 2011 | $2,084 +8.5% | $16,543 |
| 2010 | $1,920 +15% | $16,543 |
| 2009 | $1,670 +11.1% | $16,543 -13.7% |
| 2008 | $1,503 +3.2% | $19,180 |
| 2007 | $1,457 +0.8% | $19,180 |
| 2006 | $1,445 -5.1% | $19,180 +44% |
| 2005 | $1,523 +1.9% | $13,319 |
| 2004 | $1,494 +4.5% | $13,319 |
| 2003 | $1,430 -5.4% | $13,319 +31% |
| 2002 | $1,512 +6.3% | $10,167 |
| 2001 | $1,423 +7.5% | $10,167 |
| 2000 | $1,324 +0.3% | $10,167 +15.2% |
| 1999 | $1,320 | $8,829 |
Find assessor info on the county website
Monthly payment
Estimated monthly payment$1,822
All calculations are estimates and provided by Zillow, Inc. for informational purposes only. Actual amounts may vary.
HOA fees may include property taxes on listings classified as Co-Ops. Contact the listing agent and/or owner for fee details.
Mortgage interest rates are dependent on a number of factors, including credit score, down payment, and repayment length. Interest rate data provided by Zillow Group Marketplace, Inc. as of 1/1/1970 from various mortgage lenders with which we have lead or other similar arrangements; the Estimated Payment is an average of those rates.
See how much you could borrow to make a competitive offer.
Climate risks
Neighborhood: Wrightwood
Nearby schools
GreatSchools rating
- 5/10Carroll Elementary SchoolGrades: PK-8Distance: 0.7 mi
- 2/10Bogan High SchoolGrades: 9-12Distance: 1.7 mi


- Illinois
- Cook County
- Chicago
- 60652
- Wrightwood
- 7948 S Maplewood Ave
Nearby cities
Nearby neighborhoods
Nearby zip codes
Other Chicago Topics
