This 1381 square foot single family home has 4 bedrooms and 2.0 bathrooms. This home is located at 800 SW 81st Ter, North Lauderdale, FL 33068.
Pre-foreclosure
Est. $437,800
800 SW 81st Ter, North Lauderdale, FL 33068
4beds
1,381sqft
SingleFamily
Built in 1975
1,380 Square Feet Lot
$437,800 Zestimate®
$317/sqft
$-- HOA
Overview
- 258 days
- 2
- 0
Facts & features
Interior
Bedrooms & bathrooms
- Bedrooms: 4
- Bathrooms: 2
- Full bathrooms: 2
Features
- "First Floor Entry"
- Flooring: Tile, Concrete
Interior area
- Total interior livable area: 1,381 sqft
Property
Parking
- Parking features: Carport
Features
- Exterior features: Stucco, Cement / Concrete
Lot
- Size: 1,380 Square Feet
Details
- Parcel number: 494103201280
Construction
Type & style
- Home type: SingleFamily
Materials
- masonry
- Foundation: Other
- Roof: Shake / Shingle
Condition
- Year built: 1975
Community & HOA
Community
- Subdivision: North Lauderdale Village
Location
- Region: North Lauderdale
Financial & listing details
- Price per square foot: $317/sqft
- Tax assessed value: $379,430
- Annual tax amount: $12,153
Foreclosure details
Estimated market value
$437,800
$416,000 - $460,000
$3,503/mo
Price history
| Date | Event | Price |
|---|---|---|
| 9/13/2023 | Sold | $470,000-2.1%$340/sqft |
Source:  BeachesMLS #F10389515 Report a problem | ||
| 8/1/2023 | Contingent | $479,900$348/sqft |
Source: BeachesMLS #F10389515 Report a problem | ||
| 7/26/2023 | Price change | $479,900-4%$348/sqft |
Source: BeachesMLS #F10389515 Report a problem | ||
| 7/13/2023 | Listed for sale | $499,900+127.2%$362/sqft |
Source: BeachesMLS #F10389515 Report a problem | ||
| 3/15/2017 | Sold | $220,000-4.3%$159/sqft |
Source: BeachesMLS #F10048856 Report a problem | ||
| 2/19/2017 | Pending sale | $229,900$166/sqft |
Source: United Realty Group Inc #F10048856 Report a problem | ||
| 1/29/2017 | Listed for sale | $229,900+55.9%$166/sqft |
Source: United Realty Group Inc #F10048856 Report a problem | ||
| 10/26/2016 | Sold | $147,500-4.3%$107/sqft |
Source: BeachesMLS #F10015776 Report a problem | ||
| 7/8/2016 | Price change | $154,090-5%$112/sqft |
Source: RE/MAX Advisors #F10015776 Report a problem | ||
| 6/8/2016 | Listed for sale | $162,200-28.9%$117/sqft |
Source: RE/MAX Advisors #F10015776 Report a problem | ||
| 12/3/2007 | Sold | $228,000+183.2%$165/sqft |
Source: Public Record Report a problem | ||
| 9/9/1999 | Sold | $80,500-1.7%$58/sqft |
Source: Public Record Report a problem | ||
| 12/4/1993 | Sold | $81,900+51.7%$59/sqft |
Source: Public Record Report a problem | ||
| 10/21/1993 | Sold | $54,000$39/sqft |
Source: Public Record Report a problem | ||
Public tax history
| Year | Property taxes | Tax assessment |
|---|---|---|
| 2025 | $12,153 -5.8% | $308,440 -21% |
| 2024 | $12,901 +189.8% | $390,480 +93.1% |
| 2023 | $4,452 +6.8% | $202,180 +3% |
| 2022 | $4,167 +3.7% | $196,300 +3% |
| 2021 | $4,020 +7% | $190,590 +1.4% |
| 2020 | $3,757 +2% | $187,960 +2.3% |
| 2019 | $3,685 | $183,740 +1.9% |
| 2018 | $3,685 +5.8% | $180,320 +13.8% |
| 2017 | $3,482 -11.3% | $158,520 +31.4% |
| 2016 | $3,924 +19.2% | $120,600 +10% |
| 2015 | $3,291 +9.5% | $109,640 +10% |
| 2014 | $3,005 +6.8% | $99,680 +6.8% |
| 2013 | $2,814 +20.1% | $93,310 +13.3% |
| 2012 | $2,344 +8.3% | $82,390 |
| 2011 | $2,164 -11% | $82,390 -10.2% |
| 2010 | $2,432 -39.4% | $91,730 -44.2% |
| 2009 | $4,016 -21.1% | $164,330 -25.4% |
| 2008 | $5,092 +225.5% | $220,280 +156% |
| 2007 | $1,565 -4.2% | $86,050 +2.5% |
| 2006 | $1,634 | $83,960 +3% |
| 2005 | -- | $81,520 +3% |
| 2004 | $1,562 +2.8% | $79,150 +1.9% |
| 2003 | $1,520 +1% | $77,680 +2.4% |
| 2002 | $1,505 +5.7% | $75,860 +1.6% |
| 2001 | $1,424 +4% | $74,670 |
| 2000 | $1,369 | -- |
Find assessor info on the county website
Monthly payment
Climate risks
Neighborhood: 33068
- $423,1003 bd2 ba1.1k sqft8100 SW 8th St, North Lauderdale, FL 33068Off Market

- $416,0003 bd2 ba1.3k sqft8110 SW 8th St, Pompano Beach, FL 33068Off Market

- $452,1003 bd2 ba1.5k sqft8131 SW 8th St, North Lauderdale, FL 33068Off Market

- $448,9004 bd2 ba1.5k sqft8111 SW 8th St, North Lauderdale, FL 33068Off Market
Similar homes
- $465,0004 bd2 ba1.3k sqftNorth Lauderdale Village, North Lauderdale, FL 33068For Sale

 MLS ID #A12114403, Brittany Stanphill, Compass Florida, LLC. MIAMI
- $447,0004 bd2 ba1k sqftNorth Lauderdale Village, North Lauderdale, FL 33068For Sale
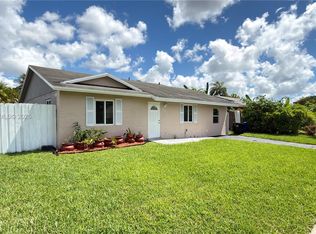 MLS ID #A12108812, Sadih Bacallao, Luxe Properties. MIAMI
- $415,0003 bd2 ba1.2k sqft8230 SW 4th Place, North Lauderdale, FL 33068For Sale

 MLS ID #B26020056, Fritz R Delouis, Solutions Realty & Financial S. BeachesMLS
- $449,0004 bd3 ba1k sqftNorth Lauderdale Village, Pompano Beach, FL 33068For Sale
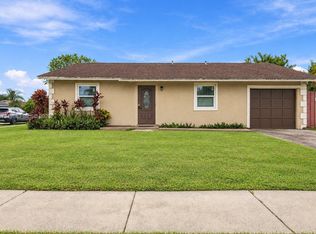 MLS ID #A12088731, Sandra Piquant, Align Right Realty K1 Group. MIAMI
- $530,0003 bd2 ba1k sqftNorth Lauderdale Village, North Lauderdale, FL 33068For SaleMLS ID #A12120788, Yuniery Rodriguez, The Lab Realty Group, LLC. MIAMI
- $445,0004 bd2 ba1.7k sqft1204 SW 74th Avenue, North Lauderdale, FL 33068For SaleMLS ID #B26074953, Taylor Reed R Kellough, Douglas Elliman. BeachesMLS
- $490,0004 bd2 ba1.3k sqftNorth Lauderdale Village, North Lauderdale, FL 33068For SaleMLS ID #A11979750, Alisha Hinds, Canvas Real Estate. MIAMI
- $450,0004 bd2 ba1.8k sqft7520 SW 6TH Court SW, North Lauderdale, FL 33068For SaleMLS ID #B26059104, Charmaine A Hickey, Lang Realty. BeachesMLS
- $459,0003 bd2 ba1.1k sqftNorth Lauderdale Village, North Lauderdale, FL 33068For SaleMLS ID #A12103379, Laurie Reader, Keller Williams Dedicated Professionals. MIAMI
- $479,9004 bd2 ba1.7k sqftNorth Lauderdale Village, Pompano Beach, FL 33068For SaleMLS ID #A12069705, Cheriyan Chacko, Josh Realty, Inc.. MIAMI
- $460,0003 bd2 ba1.2k sqft7526 SW 8th Street, North Lauderdale, FL 33068For SaleMLS ID #B26075322, Daine Morgan, Neil Realty Group LLC. BeachesMLS
- $480,0003 bd2 ba1.3k sqftLauderdale North Park Sec, North Lauderdale, FL 33068For SaleMLS ID #A12114476, Tatiana Amador, BZG International, LLC. MIAMI
- $449,9953 bd2 ba1.4k sqftNorth Lauderdale Village, North Lauderdale, FL 33068For SaleMLS ID #A11977992, Luc Honorat, Grant and Associates Real Estate INC. MIAMI
- $499,9995 bd3 ba1.6k sqft7601 Kimberly Boulevard, North Lauderdale, FL 33068For SaleMLS ID #B26043817, Ronald Point-Dujour, Perspicacity Realty & Investments, CORP. BeachesMLS
- $455,9993 bd2 ba1.3k sqft7713 Kimberly Boulevard, North Lauderdale, FL 33068For SaleMLS ID #F10552081, Sophia R Ambersley, Coldwell Banker/ Res. Real Est. BeachesMLS
- $460,0003 bd2 ba1.2k sqft405 SW 77TH AVENUE, NORTH LAUDERDALE, FL 33068For Sale
 MLS ID #TB8531427, Daylin Miranda, TRUST REALTY TEAM. Stellar MLS
- $459,0003 bd2 ba1.3k sqftNorth Lauderdale Village, Pompano Beach, FL 33068For SaleMLS ID #A12051418, Danubia Constantinou, The Real Estate Lab, Inc.. MIAMI
- $370,0003 bd2 ba1.3k sqftLauderdale North Park Sec, North Lauderdale, FL 33068For SaleMLS ID #A12113108, Jacopo Iasiello, Luxury Wealth Group, PLLC. MIAMI
- $475,0003 bd2 ba1.2k sqft8241 SW 4th Court, North Lauderdale, FL 33068For SaleMLS ID #B26014992, Jorge A Zea, Blue Lighthouse Realty, INC. BeachesMLS
