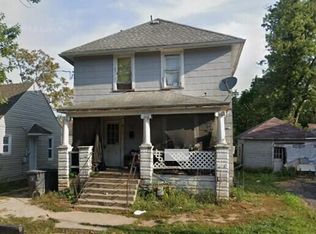
Here is a great cash flowing rental ready to add to your portfolio, or start one. Ask me for the full list of available properties and build your own package.
For sale
$82,500
801 E Vine St, Lima, OH 45804
3beds
1,248sqft
Single Family Residence
Built in 1926
-- sqft lot
$-- Zestimate®
$66/sqft
$-- HOA
What's special
- 45 days
- 49
- 3
Zillow last checked:
Listing updated:
Listed by:
Eric Schomber 567-825-3104,
EXP Realty-Dublin
Source: WCAR OH,MLS#: 311498
Facts & features
Interior
Bedrooms & bathrooms
- Bedrooms: 3
- Bathrooms: 1
- Full bathrooms: 1
Heating
- Forced Air, Natural Gas
Cooling
- None
Interior area
- Total structure area: 1,248
- Total interior livable area: 1,248 sqft
Property
Parking
- Parking features: None
Features
- Levels: Two
Details
- Parcel number: 47060514009.000
- Zoning description: Residential
Construction
Type & style
- Home type: SingleFamily
- Property subtype: Single Family Residence
Materials
- Foundation: Block
Condition
- Year built: 1926
Utilities & green energy
- Sewer: Public Sewer
- Water: Public
Community & HOA
HOA
- Has HOA: No
Location
- Region: Lima
Financial & listing details
- Price per square foot: $66/sqft
- Tax assessed value: $21,400
- Annual tax amount: $332
- Date on market: 9/5/2026
- Listing terms: Cash,Conventional
Estimated market value
Not available
Estimated sales range
Not available
$1,232/mo
Price history
| Date | Event | Price |
|---|---|---|
| 9/5/2026 | Listed for sale | $82,500-6.3%$66/sqft |
Source:  WCAR OH #311498 Report a problem | ||
| 8/18/2026 | Listing removed | $88,000$71/sqft |
Source:  MLS Now #5183904 Report a problem | ||
| 6/23/2026 | Price change | $88,000-1.1%$71/sqft |
Source: MLS Now #5183904 Report a problem | ||
| 4/25/2026 | Price change | $89,000-3.3%$71/sqft |
Source: MLS Now #5183904 Report a problem | ||
| 3/3/2026 | Price change | $92,000-3.2%$74/sqft |
Source: MLS Now #5183904 Report a problem | ||
| 2/21/2026 | Price change | $95,000-4%$76/sqft |
Source: MLS Now #5183904 Report a problem | ||
| 1/27/2026 | Listed for sale | $99,000+39.9%$79/sqft |
Source: MLS Now #5183904 Report a problem | ||
| 10/18/2025 | Listing removed | $70,750$57/sqft |
Source:  MAR #9066813 Report a problem | ||
| 7/9/2025 | Listed for sale | $70,750+57.2%$57/sqft |
Source: MAR #9066813 Report a problem | ||
| 2/27/2024 | Listing removed | -- |
Source: WCAR OH #302974 Report a problem | ||
| 1/11/2024 | Listed for sale | $45,000+205.9%$36/sqft |
Source: WCAR OH #302974 Report a problem | ||
| 3/22/2022 | Sold | $14,709-63.1%$12/sqft |
Source: WCAR OH #205485 Report a problem | ||
| 1/11/2022 | Pending sale | $39,900$32/sqft |
Source: WCAR OH #205485 Report a problem | ||
| 6/25/2021 | Listed for sale | $39,900+185%$32/sqft |
Source: WCAR OH #205485 Report a problem | ||
| 11/19/2002 | Sold | $14,000$11/sqft |
Source: Public Record Report a problem | ||
Public tax history
| Year | Property taxes | Tax assessment |
|---|---|---|
| 2025 | $332 -12.9% | $7,490 |
| 2024 | $381 +7.6% | $7,490 +4.8% |
| 2023 | $354 -12.6% | $7,150 |
| 2022 | $405 +8.7% | $7,150 |
| 2021 | $373 -2.7% | $7,150 +8.5% |
| 2020 | $383 -0.1% | $6,590 |
| 2019 | $384 +1% | $6,590 |
| 2018 | $380 -1.3% | $6,590 |
| 2017 | $385 -1.5% | $6,590 |
| 2016 | $391 -0.9% | $6,590 |
| 2015 | $395 -16.3% | $6,590 -18.8% |
| 2014 | $471 +2.5% | $8,120 |
| 2013 | $460 +0.4% | $8,120 |
| 2012 | $458 +11.2% | $8,120 -4.2% |
| 2011 | $412 +2.9% | $8,480 |
| 2010 | $400 +19.3% | $8,480 |
| 2009 | $335 +11.4% | $8,480 +12% |
| 2008 | $301 -5% | $7,570 |
| 2007 | $317 -22.8% | $7,570 +0.1% |
| 2006 | $410 +1% | $7,560 +5.4% |
| 2005 | $406 -2% | $7,175 |
| 2004 | $414 | $7,175 |
| 2003 | $414 -3.3% | $7,175 -4.7% |
| 2002 | $429 -1.3% | $7,525 |
| 2001 | $434 | $7,525 |
| 2000 | $434 +10.2% | $7,525 +10.3% |
| 1999 | $394 | $6,825 |
Find assessor info on the county website
Monthly payment
Est. payment
Payment breakdown
Explore the cost of this home by adjusting the details. Changes won't be saved.Climate risks
Neighborhood: 45804


Similar homes
- $--3 bd2 ba1.5k sqft1649 Reservoir Rd, Lima, OH 45804Auction
 Auction.com 1
- $80,0002 bd1 ba1.4k sqft1210 E Market St, Lima, OH 45804For Sale
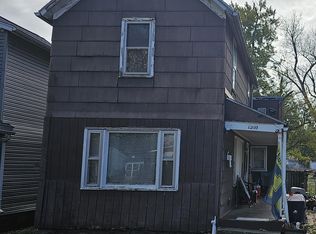
 MLS ID #311494, Eric Schomber, EXP Realty-Dublin. WCAR OH
- $69,9004 bd2 ba1.6k sqft706 E Kibby St, Lima, OH 45804For Sale
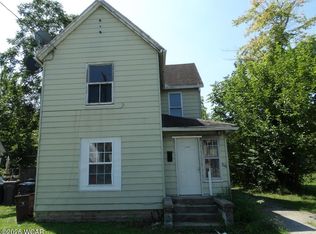 MLS ID #311085, Ronald Snyder, Premier Properties. WCAR OH
- $85,0003 bd1 ba1.4k sqft922 N Jefferson St, Lima, OH 45801For Sale
 MLS ID #311492, Eric Schomber, EXP Realty-Dublin. WCAR OH
- $85,0003 bd1 ba1.5k sqft1209 Rice Ave, Lima, OH 45805For SaleMLS ID #311501, Eric Schomber, EXP Realty-Dublin. WCAR OH
- $74,9002 bd1 ba1.1k sqft812 S Atlantic Ave, Lima, OH 45804For SaleMLS ID #310333, Chris Pocza, Cowan, Realtors. WCAR OH
- $55,0003 bd1 ba1.4k sqft812 E Vine St, Lima, OH 45804For SaleMLS ID #311463, Jaiden Johnston, EXP Realty-Dublin. WCAR OH
- $77,9004 bd1 ba1.5k sqft521 N Elizabeth St, Lima, OH 45801For SaleMLS ID #311848, Heather Gaus, Cowan, Realtors. WCAR OH
- $65,0005 bd1 ba1.5k sqft717 S Pine St, Lima, OH 45804For SaleMLS ID #310698, Samantha Wilch, Superior Plus Realtors. WCAR OH
- $63,0003 bd1 ba979 sqft513 E 4th St, Lima, OH 45804For SaleMLS ID #311490, Eric Schomber, EXP Realty-Dublin. WCAR OH
- $103,9004 bd1 ba1.4k sqft728 Holly St, Lima, OH 45804For SaleMLS ID #311821, Keith A Jackson, Superior Plus Realtors. WCAR OH
- $45,0003 bd1 ba1.2k sqft725 E Vine St, Lima, OH 45804For SaleMLS ID #311455, Jaiden Johnston, EXP Realty-Dublin. WCAR OH
- $73,0003 bd1 ba1.1k sqft703 N Collett St, Lima, OH 45805For SaleMLS ID #311741, Eric Schomber, EXP Realty-Dublin. WCAR OH
- $60,0003 bd2 ba1.8k sqft817 E Eureka St, Lima, OH 45804For SaleMLS ID #311646, Jaiden Johnston, EXP Realty-Dublin. WCAR OH
- $119,0003 bd2 ba1.1k sqft1127 E Franklin St, Lima, OH 45804For SaleMLS ID #311323, Autumn Muchow, Binkley Real Estate- Wapakoneta. WCAR OH
- $72,0003 bd1 ba1.1k sqft949 Leland Ave, Lima, OH 45805For SaleMLS ID #311807, Eric Schomber, EXP Realty-Dublin. WCAR OH
- $58,0003 bd1 ba1k sqft781 S Atlantic Ave, Lima, OH 45804For SaleMLS ID #311138, Dawn Iiames, CCR Realtors. WCAR OH
- $95,0003 bd1 ba1k sqft1417 W Wayne St, Lima, OH 45805For SaleMLS ID #311317, Shaun Richardson, EXP Realty-Dublin. WCAR OH
- $110,0002 bd2 ba936 sqft1331 Essex Dr, Lima, OH 45804For Sale
 MLS ID #1047573, Mark Ashman, Plus One Professionals. WRIST
