$244,300
3 bd|1 ba|1.1k sqft
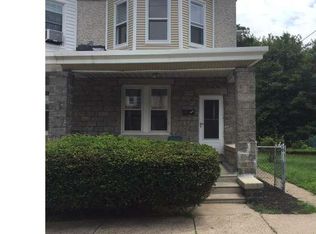
8213 Craig St, Philadelphia, PA 19136
Off Market
Zillow last checked:
Listing updated:
RONG DONG 718-755-6087,
Legacy Landmark Realty LLC 2157452480
Not available
Estimated sales range
Not available
$2,012/mo
| Date | Event | Price |
|---|---|---|
| 5/14/2026 | Listed for sale | $319,000+32.9%$283/sqft |
Source: | ||
| 1/6/2022 | Sold | $240,000$213/sqft |
Source: Public Record Report a problem | ||
| 10/22/2021 | Sold | $240,000-4%$213/sqft |
Source: | ||
| 9/3/2021 | Pending sale | $249,900$222/sqft |
Source: | ||
| 9/3/2021 | Listing removed | -- |
Source: | ||
| 9/1/2021 | Pending sale | $249,900$222/sqft |
Source: | ||
| 8/26/2021 | Listed for sale | $249,900+137.7%$222/sqft |
Source: | ||
| 8/23/2021 | Listing removed | -- |
Source: Zillow Rental Manager Report a problem | ||
| 8/10/2021 | Price change | $1,650-2.7%$1/sqft |
Source: Zillow Rental Manager Report a problem | ||
| 8/2/2021 | Listed for rent | $1,695+30.4%$2/sqft |
Source: Zillow Rental Manager Report a problem | ||
| 3/24/2021 | Listing removed | -- |
Source: Owner Report a problem | ||
| 5/25/2017 | Listing removed | $1,300$1/sqft |
Source: Owner Report a problem | ||
| 5/18/2017 | Listed for rent | $1,300$1/sqft |
Source: Owner Report a problem | ||
| 4/27/2017 | Sold | $105,150+8.5%$93/sqft |
Source: Public Record Report a problem | ||
| 3/15/2017 | Listed for sale | $96,900+73%$86/sqft |
Source: RE/MAX Realty Services-Bensalem #6944921 Report a problem | ||
| 6/14/2016 | Listing removed | $56,000$50/sqft |
Source: Homesearch.Com Realty Services Inc #5167771 Report a problem | ||
| 4/14/2016 | Listed for sale | $56,000+1500%$50/sqft |
Source: Homesearch.Com Realty Services Inc #5155093 Report a problem | ||
| 8/26/2013 | Sold | $3,500-41.7%$3/sqft |
Source: Public Record Report a problem | ||
| 1/20/2012 | Sold | $6,000-91.7%$5/sqft |
Source: Public Record Report a problem | ||
| 6/1/2000 | Sold | $71,900$64/sqft |
Source: Public Record Report a problem | ||
| Year | Property taxes | Tax assessment |
|---|---|---|
| 2025 | $3,089 +23.7% | $220,700 +23.7% |
| 2024 | $2,497 | $178,400 |
| 2023 | $2,497 +24.7% | $178,400 |
| 2022 | $2,003 | -- |
| 2021 | $2,003 +3.2% | -- |
| 2018 | $1,940 | -- |
| 2017 | $1,940 +11.2% | -- |
| 2016 | $1,745 -85.8% | -- |
| 2015 | $12,302 | -- |
| 2014 | $12,302 +629.2% | $125,900 +740.7% |
| 2012 | $1,687 | $14,976 |
| 2011 | -- | $14,976 |
| 2010 | -- | $14,976 |
| 2009 | -- | $14,976 |
| 2008 | -- | $14,976 |
| 2007 | -- | $14,976 +7.6% |
| 2006 | -- | $13,920 |
| 2005 | -- | $13,920 |
| 2004 | -- | $13,920 |
| 2003 | -- | $13,920 +6.1% |
| 2002 | -- | $13,120 |
| 2000 | -- | $13,120 |
| 1999 | -- | $13,120 |
Find assessor info on the county website
Source: Bright MLS. This data may not be complete. We recommend contacting the local school district to confirm school assignments for this home.
A local agent can set up tours, give advice and negotiate with sellers.
A local lender can help you make sure your offer is ready when you are.