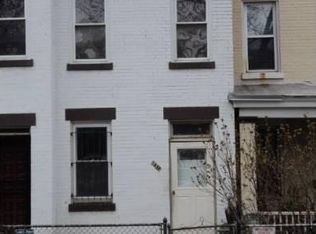
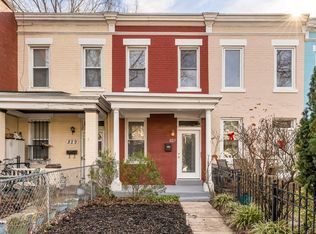
Wonderful opportunity to purchase TWO row homes in the H St corridor and walking distance to Union Market and NOMA metro. 831-833 L ST are one legal property with one tax record and two rowhomes. 831 L ST NE is currently vacant and available to show. 833 L St NE is currently occupied by a tenant. Great opportunity for a buyer who wants to live in one unit and use the second unit for investment. HURRY!
For sale
Price cut: $60K (4/3)
$935,000
833 L St NE, Washington, DC 20002
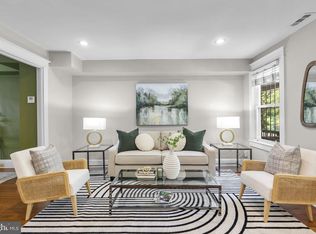
4beds
1,799sqft
Townhouse
Built in 1913
984 Square Feet Lot
$918,000 Zestimate®
$520/sqft
$-- HOA
What's special
- 245 days |
- 137 |
- 5 |
Zillow last checked:
Listing updated:
Listed by:
Vanessa Hardee 202-469-1465,
Long & Foster Real Estate, Inc.
Source: Bright MLS,MLS#: DCDC2229158
Loading...
Facts & features
Interior
Bedrooms & bathrooms
- Bedrooms: 4
- Bathrooms: 3
- Full bathrooms: 3
- Main level bathrooms: 1
Heating
- Baseboard, Natural Gas
Cooling
- Central Air, Electric
Appliances
- Included: Gas Water Heater
Features
- Has basement: No
- Has fireplace: No
Interior area
- Total structure area: 1,799
- Total interior livable area: 1,799 sqft
- Finished area above ground: 1,799
Property
Parking
- Parking features: On Street
- Has uncovered spaces: Yes
Accessibility
- Accessibility features: None
Features
- Levels: Two
- Stories: 2
- Pool features: None
Lot
- Size: 984 Square Feet
- Features: Urban Land-Sassafras-Chillum
Details
- Additional structures: Above Grade
- Parcel number: 0909//0074
- Zoning: RF-1
- Special conditions: Standard
Construction
Type & style
- Home type: Townhouse
- Architectural style: Colonial
- Property subtype: Townhouse
Materials
- Brick
- Foundation: Slab
Condition
- New construction: No
- Year built: 1913
Utilities & green energy
- Sewer: Public Sewer
- Water: Public
Community & HOA
Community
- Subdivision: H Street Corridor
HOA
- Has HOA: No
Location
- Region: Washington
Financial & listing details
- Price per square foot: $520/sqft
- Tax assessed value: $801,260
- Annual tax amount: $6,792
- Date on market: 10/24/2025
- Listing agreement: Exclusive Right To Sell
- Listing terms: Cash,Conventional,FHA,VA Loan
- Ownership: Fee Simple
Estimated market value
$918,000
$872,000 - $964,000
$4,927/mo
Price history
| Date | Event | Price |
|---|---|---|
| 4/3/2026 | Price change | $935,000-6%$520/sqft |
Source: | ||
| 10/24/2025 | Listed for sale | $995,000+2387.5%$553/sqft |
Source: | ||
| 7/22/2020 | Listing removed | $2,100$1/sqft |
Source: Early Star LLC. Report a problem | ||
| 7/20/2020 | Listed for rent | $2,100-4.5%$1/sqft |
Source: Early Star LLC. Report a problem | ||
| 4/18/2016 | Listing removed | $2,200$1/sqft |
Source: Early Star LLC. Report a problem | ||
| 2/17/2016 | Price change | $2,200-12%$1/sqft |
Source: Early Star LLC. Report a problem | ||
| 12/9/2015 | Listed for rent | $2,500+31.6%$1/sqft |
Source: Early Star LLC. Report a problem | ||
| 5/17/2013 | Listing removed | $1,900$1/sqft |
Source: Early Star LLC. Report a problem | ||
| 4/9/2013 | Price change | $1,900-5%$1/sqft |
Source: Early Star LLC. Report a problem | ||
| 2/28/2013 | Listed for rent | $2,000$1/sqft |
Source: Early Star LLC. Report a problem | ||
| 2/9/1995 | Sold | $40,000$22/sqft |
Source: Public Record Report a problem | ||
Public tax history
| Year | Property taxes | Tax assessment |
|---|---|---|
| 2025 | $6,811 +0.3% | $801,260 +0.3% |
| 2024 | $6,792 +3.6% | $799,050 +3.6% |
| 2023 | $6,556 +5.7% | $771,320 +5.7% |
| 2022 | $6,203 +4.8% | $729,780 +4.8% |
| 2021 | $5,917 +3.9% | $696,140 +3.9% |
| 2020 | $5,694 +14.4% | $669,850 +14.4% |
| 2018 | $4,975 +4.8% | $585,290 +4.8% |
| 2017 | $4,748 +12.6% | $558,640 +12.6% |
| 2016 | $4,217 +21% | $496,090 +21% |
| 2015 | $3,486 +7.7% | $410,060 +7.7% |
| 2014 | $3,237 +5.8% | $380,810 +5.8% |
| 2013 | $3,059 0% | $359,940 0% |
| 2012 | $3,060 | $360,040 |
| 2011 | $3,060 +15.4% | $360,040 +15.4% |
| 2010 | $2,653 -11.7% | $312,100 -11.7% |
| 2009 | $3,006 +3.5% | $353,590 +7.1% |
| 2007 | $2,905 +38.8% | $330,060 +45.1% |
| 2006 | $2,093 +24.6% | $227,500 +30% |
| 2005 | $1,680 +40% | $175,000 +40% |
| 2004 | $1,200 -14.4% | $125,000 -14.4% |
| 2003 | $1,402 +18.1% | $146,050 +18.1% |
| 2002 | $1,187 -16.5% | $123,686 |
| 2001 | $1,422 | $123,686 |
Find assessor info on the county website
Monthly payment
Est. payment$--/mo
Payment breakdown
Explore the cost of this home by adjusting the details. Changes won't be saved.All calculations are estimates and provided by Zillow, Inc. for informational purposes only. Actual amounts may vary.
HOA fees may include property taxes on listings classified as Co-Ops. Contact the listing agent and/or owner for fee details.
Mortgage interest rates are dependent on a number of factors, including credit score, down payment, and repayment length. Interest rate data provided by Zillow Group Marketplace, Inc. as of 1/1/1970 from various mortgage lenders with which we have lead or other similar arrangements; the Estimated Payment is an average of those rates.
See how much you could borrow to make a competitive offer.
Climate risks
Neighborhood: Near Northeast
Nearby schools
GreatSchools rating
- 8/10J.O. Wilson Elementary SchoolGrades: PK-5Distance: 1.1 mi
- 8/10Stuart-Hobson Middle SchoolGrades: 6-8Distance: 0.6 mi
- 3/10Eastern High SchoolGrades: 9-12Distance: 1.2 mi
Schools provided by the listing agent
- District: District Of Columbia Public Schools
Source: Bright MLS. This data may not be complete. We recommend contacting the local school district to confirm school assignments for this home.

A local agent can set up tours, give advice and negotiate with sellers.


Nearby cities
Nearby neighborhoods
Nearby zip codes
Other Washington Topics
