Opportunity awaits with this 2-bedroom, 1-bath home situated on approximately 0.30 acres. Featuring an open living area, rustic wood finishes, and a large tiled walk-in shower. This property offers plenty of potential for the right buyer. The home does need foundation leveling, and a little love making it an ideal project for investors, or buyers looking to build equity.
For sale
$55,000
835 Bridgeview St, Bridge City, TX 77611
2beds
1,008sqft
Single Family Residence
Built in ----
0.3 Acres Lot
$-- Zestimate®
$55/sqft
$-- HOA
What's special
Large tiled walk-in showerRustic wood finishes
- 15 days
- 194
- 7
Likely to sell faster than
Zillow last checked:
Listing updated:
Listed by:
Allison Cornett 409-782-6924,
Full Circle Texas
Source: BBOR,MLS#: 272182
Facts & features
Interior
Bedrooms & bathrooms
- Bedrooms: 2
- Bathrooms: 1
- Full bathrooms: 1
Primary bathroom
- Features: Shower Only
Dining room
- Features: Breakfast Room
Living room
- Features: Living Room
Heating
- None
Cooling
- Window Unit(s)
Appliances
- Included: Dryer, Washer, Free-Standing Range
Features
- Ceiling Fan(s)
- Flooring: Vinyl
- Has fireplace: No
Interior area
- Total structure area: 1,008
- Total interior livable area: 1,008 sqft
Property
Features
- Levels: One
- Stories: 1
Lot
- Size: 0.3 Acres
Details
- Additional structures: Storage
- Parcel number: 001561000670
- Special conditions: Standard
Construction
Type & style
- Home type: SingleFamily
- Property subtype: Single Family Residence
Materials
- Roof: Metal
Condition
- 31 Yrs. and Older
- New construction: No
Utilities & green energy
- Sewer: City Sewer
- Water: City Water
Community & HOA
Community
- Subdivision: Bridgeview
Location
- Region: Bridge City
Financial & listing details
- Price per square foot: $55/sqft
- Tax assessed value: $97,514
- Annual tax amount: $2,171
- Date on market: 11/3/2026
- Listing terms: Cash,Conventional
- Road surface type: Asphalt
Estimated market value
Not available
Estimated sales range
Not available
$1,432/mo
Price history
| Date | Event | Price |
|---|---|---|
| 11/3/2026 | Listed for sale | $55,000-8.2%$55/sqft |
Source:  BBOR #272182 Report a problem | ||
| 9/5/2026 | Listing removed | $59,900$59/sqft |
Source: BBOR #269879 Report a problem | ||
| 8/18/2026 | Price change | $59,900-20.1%$59/sqft |
Source: BBOR #269879 Report a problem | ||
| 8/4/2026 | Listed for sale | $75,000$74/sqft |
Source: BBOR #269879 Report a problem | ||
Public tax history
| Year | Property taxes | Tax assessment |
|---|---|---|
| 2025 | $2,171 -1.5% | $97,514 -2% |
| 2024 | $2,204 +11.1% | $99,524 +12.6% |
| 2023 | $1,984 +32.3% | $88,407 +36.3% |
| 2022 | $1,499 +8.2% | $64,842 +8.4% |
| 2021 | $1,385 +11.1% | $59,842 +13.9% |
| 2020 | $1,246 +0.3% | $52,532 +2.9% |
| 2019 | $1,242 +3.6% | $51,045 +4.3% |
| 2018 | $1,199 | $48,932 |
| 2017 | $1,199 +6.4% | $48,932 +6.8% |
| 2016 | $1,127 +552.2% | $45,809 +543.2% |
| 2015 | $173 | $7,122 |
| 2014 | $173 | $7,122 |
| 2013 | -- | $7,122 -16% |
| 2012 | -- | $8,474 |
| 2011 | -- | $8,474 +29.3% |
| 2010 | -- | $6,554 +25% |
| 2009 | -- | $5,243 -90.2% |
| 2008 | -- | $53,698 +3.8% |
| 2007 | -- | $51,752 +17.3% |
| 2006 | -- | $44,118 +0.3% |
| 2005 | -- | $43,985 |
| 2004 | -- | -- |
| 2003 | -- | -- |
| 2002 | -- | -- |
| 2001 | -- | -- |
Find assessor info on the county website
Monthly payment
Est. payment
Payment breakdown
Explore the cost of this home by adjusting the details. Changes won't be saved.Climate risks
Neighborhood: 77611
- $133,200-- bd-- ba1.2k sqft845 Bridgeview St, Bridge City, TX 77611Off Market
- $125,9002 bd2 ba1k sqft825 Bridgeview St, Bridge City, TX 77611Off Market
- $112,300-- bd-- ba1k sqft855 Bridgeview St, Bridge City, TX 77611Off Market
- $186,4003 bd2 ba1.2k sqft840 Bridgeview St, Bridge City, TX 77611Off Market

Similar homes
- $59,9503 bd1 ba1.2k sqft409 Bridal Wreath Ave, Orange, TX 77630For Sale
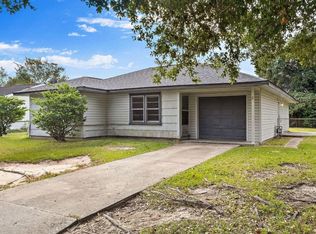 MLS ID #68145140, Terrance Connors, Meridian Reside. HAR
- $72,0003 bd1 ba896 sqft327 Devillier St, Bridge City, TX 77611For Sale

 MLS ID #271181, ROHN McMANUS, BAYOU STATE REAL ESTATE, LLC -- 9003431. BBOR
- $60,0002 bd1 ba812 sqft3412 Lark St, Orange, TX 77630For Sale
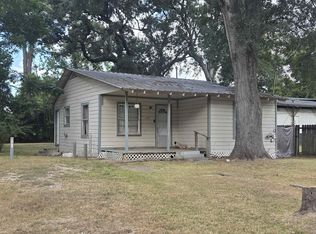 MLS ID #270616, Bevin Frakes, Susan Creel. BBOR
- $55,0003 bd1 ba1.1k sqft3537 9th St, Port Arthur, TX 77642For Sale
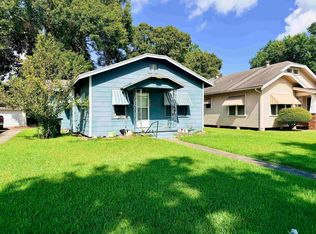 MLS ID #271891, TY FRENCH, RE/MAX ONE - NEDERLAND. BBOR
- $65,0003 bd2 ba1.1k sqft4180 Carlene, Orange, TX 77630For SaleMLS ID #270484, Benjamin Rodriguez, Triangle Real Estate, LLC. BBOR
- $59,5003 bd1 ba1k sqft2190 Frazier St, Vidor, TX 77662For SaleMLS ID #266464, Amanda Green, JLA Realty. BBOR
- $60,0003 bd1 ba1k sqft1525 Liberty Ave, Port Arthur, TX 77640For SaleMLS ID #270406, Laci Simien, JLA Realty. BBOR
- $62,5004 bd2 ba1.4k sqft990 Doucette Ave, Beaumont, TX 77701For SaleMLS ID #271531, Kisha Roberts, RE/MAX ONE. BBOR
- $63,0002 bd1 ba840 sqft980 Harriot St, Beaumont, TX 77705For SaleMLS ID #272261, Ashley Higginbotham, eXp Realty, LLC. BBOR
- $49,9003 bd1 ba1k sqft3282 Brent Dr, Orange, TX 77632For SaleMLS ID #268271, ROHN McMANUS, BAYOU STATE REAL ESTATE, LLC -- 9003431. BBOR
- $59,9992 bd1 ba980 sqft1833 11th St, Port Arthur, TX 77640For SaleMLS ID #269337, Patrick January, JLA Realty. BBOR
- $65,0003 bd2 ba1.2k sqft350 Greathouse St, Vidor, TX 77662For SaleMLS ID #270161, SALVADOR CABALLERO, LISTWITHFREEDOM.COM, LLC -- 9010181. BBOR
- $65,0002 bd1 ba946 sqft4 Circle #C, Orange, TX 77630For SaleMLS ID #264814, Atasha Quebedeaux, Re/Max Pro. BBOR
- $59,0004 bd2 ba1.4k sqft2460 Emile St, Beaumont, TX 77701For SaleMLS ID #270196, Andres Sanchez, American Real Estate ERA Power - Beaumont. BBOR
