Welcome home to this beautifully updated property! Fresh paint and new flooring create a clean, inviting feel throughout. Enjoy a spacious living room, a large den perfect for relaxing or entertaining, and a welcoming front porch to unwind outdoors. This home is totally electric and with central heating and air, this home offers comfort and versatility. Don't miss the opportunity to make this charming property your own!
For sale
$120,000
837 Fulton Ave, Columbus, GA 31906
3beds
1,288sqft
Single Family Residence
Built in 1998
4,791 Square Feet Lot
$-- Zestimate®
$93/sqft
$-- HOA
What's special
Central heating and airNew flooringFresh paint
- 39 days
- 217
- 4
Zillow last checked:
Listing updated:
Listed by:
Clarice Valdez 915-275-8655,
1st Class Real Estate Excellence
Source: CBORGA,MLS#: 234657
Facts & features
Interior
Bedrooms & bathrooms
- Bedrooms: 3
- Bathrooms: 2
- Full bathrooms: 2
Rooms
- Room types: Den, Living Room
Dining room
- Features: Dining/Living
Kitchen
- Features: Breakfast Area
Cooling
- Ceiling Fan(s)
Interior area
- Total structure area: 1,288
- Total interior livable area: 1,288 sqft
Property
Features
- Levels: One
Lot
- Size: 4,791 Square Feet
- Features: Corner Lot
Details
- Parcel number: 039 013 008A
- Special conditions: Standard
Construction
Type & style
- Home type: SingleFamily
- Property subtype: Single Family Residence
Materials
- Brick
Condition
- New construction: No
- Year built: 1998
Utilities & green energy
- Sewer: Public Sewer
- Water: Public
Community & HOA
Community
- Security: None
- Subdivision: Stafford Place
Location
- Region: Columbus
Financial & listing details
- Price per square foot: $93/sqft
- Tax assessed value: $60,430
- Annual tax amount: $946
- Date on market: 10/10/2026
Estimated market value
Not available
Estimated sales range
Not available
Not available
Price history
| Date | Event | Price |
|---|---|---|
| 10/10/2026 | Listed for sale | $120,000+20%$93/sqft |
Source:  CBORGA #234657 Report a problem | ||
| 7/16/2026 | Listing removed | $895$1/sqft |
Source: Zillow Rentals Report a problem | ||
| 6/18/2026 | Listed for rent | $895-10.5%$1/sqft |
Source: Zillow Rentals Report a problem | ||
| 1/1/2026 | Listing removed | $1,000$1/sqft |
Source: Zillow Rentals Report a problem | ||
| 10/23/2025 | Price change | $1,000-9.1%$1/sqft |
Source: Zillow Rentals Report a problem | ||
| 8/9/2025 | Listed for rent | $1,100-6.4%$1/sqft |
Source: Zillow Rentals Report a problem | ||
| 7/22/2025 | Listing removed | $99,999$78/sqft |
Source: CBORGA #219279 Report a problem | ||
| 7/12/2025 | Listed for sale | $99,999$78/sqft |
Source: CBORGA #219279 Report a problem | ||
| 7/3/2025 | Pending sale | $99,999$78/sqft |
Source: CBORGA #219279 Report a problem | ||
| 5/22/2025 | Price change | $99,999-5.7%$78/sqft |
Source: CBORGA #219279 Report a problem | ||
| 4/27/2025 | Listed for sale | $106,000$82/sqft |
Source: CBORGA #219279 Report a problem | ||
| 4/21/2025 | Pending sale | $106,000$82/sqft |
Source: CBORGA #219279 Report a problem | ||
| 2/6/2025 | Listed for sale | $106,000-3.6%$82/sqft |
Source: CBORGA #219279 Report a problem | ||
| 7/6/2024 | Listing removed | $110,000$85/sqft |
Source: CBORGA #210175 Report a problem | ||
| 7/4/2024 | Listing removed | -- |
Source: Zillow Rentals Report a problem | ||
| 6/12/2024 | Price change | $1,175-13%$1/sqft |
Source: Zillow Rentals Report a problem | ||
| 6/10/2024 | Price change | $110,000-8.3%$85/sqft |
Source: CBORGA #210175 Report a problem | ||
| 5/16/2024 | Listed for rent | $1,350$1/sqft |
Source: Zillow Rentals Report a problem | ||
| 2/12/2024 | Listed for sale | $120,000-7.7%$93/sqft |
Source: CBORGA #210175 Report a problem | ||
| 2/9/2024 | Listing removed | -- |
Source:  GAMLS #10243079 Report a problem | ||
| 1/18/2024 | Price change | $130,000-7.1%$101/sqft |
Source: GAMLS #10243079 Report a problem | ||
| 11/3/2023 | Price change | $140,000-6.7%$109/sqft |
Source:  South Georgia MLS #137202 Report a problem | ||
| 10/3/2023 | Listed for sale | $150,000+233.3%$116/sqft |
Source: South Georgia MLS #137202 Report a problem | ||
| 6/5/2023 | Sold | $45,000-11.8%$35/sqft |
Source:  FMLS GA #7221161 Report a problem | ||
| 5/30/2023 | Pending sale | $51,000$40/sqft |
Source: GAMLS #10162862 Report a problem | ||
Public tax history
| Year | Property taxes | Tax assessment |
|---|---|---|
| 2025 | $946 +0% | $24,172 |
| 2024 | $946 +93.4% | $24,172 +94.6% |
| 2023 | $489 -10.6% | $12,420 -7.3% |
| 2022 | $547 +22.5% | $13,404 +22.5% |
| 2021 | $447 0% | $10,944 |
| 2020 | $447 -0.3% | $10,944 |
| 2019 | $448 | $10,944 |
| 2018 | $448 | $10,944 |
| 2017 | $448 -44.2% | $10,944 -43.9% |
| 2016 | $804 | $19,494 |
| 2015 | $804 -0.1% | $19,494 |
| 2014 | $805 -0.1% | $19,494 |
| 2013 | $806 -0.2% | $19,494 |
| 2012 | $808 -0.1% | $19,494 |
| 2011 | $809 +21.2% | $19,494 |
| 2010 | $667 -17.6% | $19,494 |
| 2009 | $810 0% | -- |
| 2008 | $810 | -- |
| 2007 | $810 | $19,494 |
| 2006 | $810 | $19,494 |
| 2005 | $810 | $19,494 |
| 2004 | $810 | $19,494 |
| 2003 | -- | $19,494 |
| 2002 | -- | $19,494 |
| 2001 | -- | $19,494 |
| 2000 | -- | $19,494 |
Find assessor info on the county website
Monthly payment
Est. payment
Payment breakdown
Explore the cost of this home by adjusting the details. Changes won't be saved.Climate risks
Neighborhood: Radcliff
Similar homes
- $115,0003 bd1 ba1.1k sqft2513 7th St, Columbus, GA 31906For Sale

 MLS ID #234513, Angie Jackson, Coldwell Banker / Kennon, Parker, Duncan & Davis. CBORGA
- $125,0003 bd1 ba1k sqft406 48th St, Columbus, GA 31904For Sale
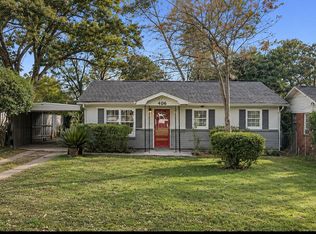 MLS ID #235192, Alecia Matheson, Coldwell Banker / Kennon, Parker, Duncan & Davis. CBORGA
- $134,9003 bd2 ba1.5k sqft428 Florida Dr, Columbus, GA 31906For Sale
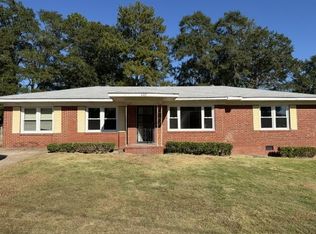 MLS ID #235088, Keith Hammond, Prime Realty Co.. CBORGA
- $129,0002 bd1 ba1.1k sqft2211 8th St, Columbus, GA 31906For Sale
 MLS ID #232899, Angie Jackson, Coldwell Banker / Kennon, Parker, Duncan & Davis. CBORGA
- $124,5003 bd2 ba1.2k sqft731 Southern Pines Dr, Columbus, GA 31907For SaleMLS ID #232559, Anthony Smith, 1st Class Real Estate Excellence. CBORGA
- $94,9002 bd2 ba1.4k sqft2808 9th St, Columbus, GA 31906For SaleMLS ID #233905, Kristina Finney, Keller Williams Realty River Cities. CBORGA
- $92,5003 bd2 ba1.1k sqft3537 Bondwood Dr, Columbus, GA 31906Active
 MLS ID #10867373, Jacqueline Fielder, RADIANT & Co. Realty. GAMLS
- $124,9002 bd1 ba1k sqft3409 Cherokee Ave, Columbus, GA 31906For SaleMLS ID #230739, Jill Land, Coldwell Banker / Kennon, Parker, Duncan & Davis. CBORGA
- $125,0002 bd1 ba1k sqft1314 18th St, Columbus, GA 31901For SaleMLS ID #234352, Brandon Dean, Coldwell Banker / Kennon, Parker, Duncan & Davis. CBORGA
- $144,9003 bd2 ba1.3k sqft3015 N Lumpkin Rd, Columbus, GA 31903For SaleMLS ID #235062, Cristian Portillo, Coldwell Banker / Kennon, Parker, Duncan & Davis. CBORGA
- $125,0003 bd1 ba1.1k sqft468 Bowen Blvd, Columbus, GA 31907For SaleMLS ID #234704, Eboney Stephens, Bickerstaff Parham, LLC. CBORGA
- $134,9004 bd2 ba1.4k sqft5414 Spencer Ln, Columbus, GA 31907ActiveMLS ID #10841424, Ingrid Gamboa, Plains Realty Partners. GAMLS
- $135,0003 bd2 ba1.1k sqft442 Timberlane Dr, Columbus, GA 31907ActiveMLS ID #10876773, Bionca Bell, eXp Realty. GAMLS
- $160,0003 bd1 ba1.1k sqft2953 Mimosa St, Columbus, GA 31906For SaleMLS ID #233918, Tyler Ward, Coldwell Banker / Kennon, Parker, Duncan & Davis. CBORGA
- $129,0003 bd1 ba1.3k sqft242 Sidney Dr, Columbus, GA 31907For SaleMLS ID #234127, Verronica Smith, Coldwell Banker / Kennon, Parker, Duncan & Davis. CBORGA
- $129,9002 bd1 ba1.2k sqft1435 22nd St, Columbus, GA 31901For SaleMLS ID #232958, Lee Jordan, Blue Sky Realty. CBORGA
- $118,0003 bd2 ba1.8k sqft2924 12th Ave, Columbus, GA 31904For SaleMLS ID #233899, Cindy Guzman, Keller Williams Realty River Cities. CBORGA
- $124,9003 bd1 ba1k sqft4471 Sims St, Columbus, GA 31907For SaleMLS ID #234120, Kacey Wallace, Coldwell Banker / Kennon, Parker, Duncan & Davis. CBORGA
- $115,0002 bd2 ba960 sqft485 Mellon St, Columbus, GA 31903For SaleMLS ID #228319, Jonathan Dicesaris, Coldwell Banker / Kennon, Parker, Duncan & Davis. CBORGA
- $115,0003 bd2 ba1.5k sqft1102 Calvin Ave, Columbus, GA 31903ActiveMLS ID #10707110, Christina Stewart, Keller Williams River Cities. GAMLS
