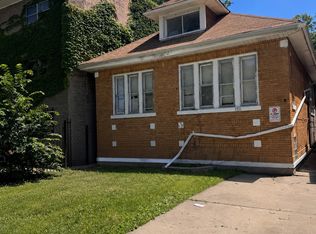
$88,980
2 bd|1 ba|937 sqft
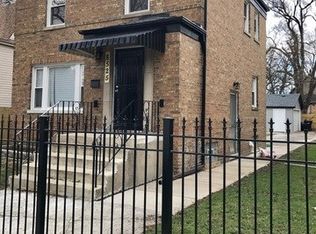
8531 S May St, Chicago, IL 60620
Off Market
Zillow last checked:
Donna Baker 708-466-4558,
Kale Realty
Not available
Estimated sales range
Not available
Not available
| Date | Event | Price |
|---|---|---|
| 3/8/2020 | Listing removed | $123,500$88/sqft |
Source: Coldwell Banker Residential Brokerage - Hyde Park #10548886 Report a problem | ||
| 1/30/2020 | Price change | $123,500-2.7%$88/sqft |
Source: Coldwell Banker Residential Brokerage - Hyde Park #10548886 Report a problem | ||
| 11/6/2019 | Price change | $126,900-2.3%$90/sqft |
Source: Coldwell Banker Residential Brokerage - Hyde Park #10548886 Report a problem | ||
| 10/31/2019 | Price change | $129,900-3.7%$92/sqft |
Source: Coldwell Banker Residential Brokerage - Hyde Park #10548886 Report a problem | ||
| 10/27/2019 | Price change | $134,900-5.6%$96/sqft |
Source: Coldwell Banker Residential Brokerage - Hyde Park #10548886 Report a problem | ||
| 10/16/2019 | Listed for sale | $142,900+429.3%$102/sqft |
Source: Coldwell Banker Residential #10548886 Report a problem | ||
| 6/6/2017 | Listing removed | $1,500$1/sqft |
Source: Owner Report a problem | ||
| 5/30/2017 | Listed for rent | $1,500$1/sqft |
Source: Owner Report a problem | ||
| 10/26/2011 | Sold | $27,000$19/sqft |
Source: | ||
| Year | Property taxes | Tax assessment |
|---|---|---|
| 2024 | -- | $13,001 +0% |
| 2023 | $2,743 +2.6% | $12,999 |
| 2022 | $2,674 +2.3% | $12,999 |
| 2021 | $2,614 -7% | $12,999 +3% |
| 2020 | $2,810 +0.9% | $12,616 -9% |
| 2019 | $2,785 +1.7% | $13,864 |
| 2018 | $2,739 -6% | $13,864 +2.4% |
| 2017 | $2,914 +7.5% | $13,536 |
| 2016 | $2,711 +9.3% | $13,536 |
| 2015 | $2,480 +17.1% | $13,536 +18.6% |
| 2014 | $2,118 +2% | $11,417 |
| 2013 | $2,076 +1.4% | $11,417 |
| 2012 | $2,049 +11.4% | $11,417 -23.5% |
| 2011 | $1,838 +12.1% | $14,929 |
| 2010 | $1,640 +17% | $14,929 |
| 2009 | $1,403 +5.9% | $14,929 +4.8% |
| 2008 | $1,325 +3.2% | $14,241 |
| 2007 | $1,284 +0.8% | $14,241 |
| 2006 | $1,274 -5.1% | $14,241 +33.8% |
| 2005 | $1,343 +1.9% | $10,646 |
| 2004 | $1,318 +4.5% | $10,646 |
| 2003 | $1,262 -5.4% | $10,646 +15.1% |
| 2002 | $1,334 +6.6% | $9,247 |
| 2001 | $1,251 +41.9% | $9,247 |
| 2000 | $882 | $9,247 +40.3% |
| 1999 | -- | $6,589 |
Find assessor info on the county website
Source: MRED as distributed by MLS GRID. This data may not be complete. We recommend contacting the local school district to confirm school assignments for this home.
A local agent can set up tours, give advice and negotiate with sellers.
A local lender can help you make sure your offer is ready when you are.