Cash or hard money/private lending only. Frame structure in need of repairs, sold as-is, on a 10,064 sq ft lot. Property Appraiser lists Primary Zone 5700 (Duplexes – General) and Land Use 0802 (Multifamily 2–9 Units: 2 living units).
For sale
$264,999
8721 NW 21st Ave, Miami, FL 33147
--beds
--baths
1,066sqft
Duplex
Built in 1947
-- sqft lot
$-- Zestimate®
$249/sqft
$-- HOA
What's special
- 43 days
- 615
- 41
Zillow last checked:
Listing updated:
Listed by:
Luis Gonzalez LLC 305-924-1119,
Coldwell Banker Realty
Source: MIAMI,MLS#: A12101101 Originating MLS: A-Miami Association of REALTORS
Facts & features
Interior
Heating
- Central
Cooling
- Central Air
Features
- Flooring: Ceramic Tile
Interior area
- Total structure area: 1,226
- Total interior livable area: 1,066 sqft
Property
Features
- Stories: 1
Lot
- Features: 1/4 To Less Than 1/2 Acre Lot
Details
- Parcel number: 3031030220460
- Zoning: 5700
Construction
Type & style
- Home type: MultiFamily
- Property subtype: Duplex
Materials
- Frame
- Roof: Shingle
Condition
- Year built: 1947
Utilities & green energy
- Sewer: Public Sewer
Community & HOA
Community
- Subdivision: Home Acres
HOA
- Has HOA: No
Location
- Region: Miami
Financial & listing details
- Price per square foot: $249/sqft
- Tax assessed value: $320,959
- Annual tax amount: $3,655
- Date on market: 10/5/2026
- Listing terms: All Cash
Estimated market value
Not available
Estimated sales range
Not available
Not available
Price history
| Date | Event | Price |
|---|---|---|
| 10/5/2026 | Listed for sale | $264,999-13.1%$249/sqft |
Source:  MIAMI #A12101101 Report a problem | ||
| 9/10/2022 | Listing removed | -- |
Source: MIAMI #A11241063 Report a problem | ||
| 7/14/2022 | Listed for sale | $305,000+1.7%$286/sqft |
Source: MIAMI #A11241063 Report a problem | ||
| 7/8/2022 | Listing removed | -- |
Source: MIAMI #A11212438 Report a problem | ||
| 5/25/2022 | Listed for sale | $300,000+58.7%$281/sqft |
Source: MIAMI #A11212438 Report a problem | ||
| 6/14/2006 | Sold | $189,000+89%$177/sqft |
Source: Public Record Report a problem | ||
| 6/6/2003 | Sold | $100,000+354.5%$94/sqft |
Source: Public Record Report a problem | ||
| 2/20/2001 | Sold | $22,000+131.6%$21/sqft |
Source: Public Record Report a problem | ||
| 12/28/2000 | Sold | $9,500-81.4%$9/sqft |
Source: Public Record Report a problem | ||
| 6/4/1997 | Sold | $51,000$48/sqft |
Source: Public Record Report a problem | ||
Public tax history
| Year | Property taxes | Tax assessment |
|---|---|---|
| 2025 | $4,382 +0.4% | $148,217 +10% |
| 2024 | $4,366 +12.1% | $134,743 +10% |
| 2023 | $3,897 +23.3% | $122,494 +26.5% |
| 2022 | $3,159 +16.8% | $96,858 +10% |
| 2021 | $2,704 +11.7% | $88,053 +10% |
| 2020 | $2,421 +19.5% | $80,049 +10% |
| 2019 | $2,026 +16.6% | $72,772 +10% |
| 2018 | $1,738 | $66,157 +10% |
| 2017 | $1,738 +3.5% | $60,143 +10% |
| 2016 | $1,679 +16.6% | $54,676 +10% |
| 2015 | $1,441 +6.6% | $49,706 +10% |
| 2014 | $1,352 +10.4% | $45,188 +10% |
| 2013 | $1,225 | $41,080 +0.3% |
| 2012 | $1,225 -9.4% | $40,949 -12.5% |
| 2011 | $1,351 -15.4% | $46,804 -15.3% |
| 2010 | $1,598 -24.1% | $55,286 -36.4% |
| 2009 | $2,105 -5.3% | $86,945 -8% |
| 2007 | $2,223 +15.5% | $94,502 |
| 2006 | $1,924 | -- |
| 2005 | $1,924 +17.6% | -- |
| 2004 | $1,636 +39.9% | -- |
| 2003 | $1,170 +15.4% | -- |
| 2002 | $1,014 | -- |
| 2001 | $1,014 | -- |
Find assessor info on the county website
Monthly payment
Est. payment
Payment breakdown
Explore the cost of this home by adjusting the details. Changes won't be saved.Climate risks
Neighborhood: 33147

Similar homes
- $349,9993 bd1 ba1.2k sqftRev Pl W Little River, Miami, FL 33147For Sale

 MLS ID #A12121613, Joshua Rivera, Top Tier International Realty, LLC.. MIAMI
- $390,0002 bd1 ba891 sqftSerino Sub, Miami, FL 33147For Sale
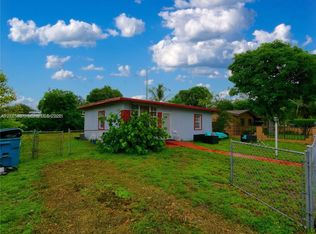 MLS ID #A12121487, Lenuam Garcia, The Heat Realty of S.F. LLC. MIAMI
- $350,0002 bd1 ba768 sqftHome Acres, Miami, FL 33147For Sale
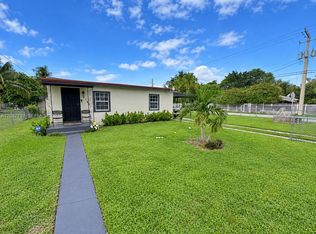 MLS ID #A12087713, Mario Avalos, K & A Realty. MIAMI
- $295,0003 bd1 ba1.1k sqft1899 NW 53RD Street, Miami, FL 33142For Sale

 MLS ID #B26100339, Robert Baker, VantaSure Realty LLC. BeachesMLS
- $340,0002 bd1 ba735 sqftLualeah A Sub, Miami, FL 33147For SaleMLS ID #A12112554, Luel Alemu, Keller Williams Capital Realty. MIAMI
- $299,9902 bd1 ba740 sqftHialeah Heights, Miami, FL 33142For SaleMLS ID #A12123021, Francesco Fassioli, Kariza Capital Realty, LLC. MIAMI
- $250,0003 bd2 ba1.1k sqftSunset Palm Villas, Miami, FL 33150For SaleMLS ID #A12064592, Vicente Rodriguez, Fausto Commercial Realty Consultants Inc. MIAMI
- $270,0003 bd1 ba856 sqftWoodmere Sub, Miami, FL 33150For SaleMLS ID #A12075176, Maritza Miller, Phantom Real Estate. MIAMI
- $236,0004 bd2 ba1.4k sqftSunset Palm Villas, Miami, FL 33150For SaleMLS ID #A12074426, Amalia Ortiz PA, Grand Realty of America, Corp.. MIAMI
- $245,0002 bd1 ba801 sqftStephen Manor, Miami, FL 33150For SaleMLS ID #A12111671, Jason Welt, Trustee Realty Inc.. MIAMI
- $389,9994 bd2 ba1.4k sqftPara Villa Heights, Miami, FL 33147For SaleMLS ID #A12040202, Luigui Ferrer, Smart Miami Realty, LLC.. MIAMI
- $340,0002 bd1 ba1.2k sqft6312 NW 17th Avenue, Miami, FL 33147For SaleMLS ID #B26041467, Karla Guadamuz Davis, I Love Mi Casa Realty LLC. BeachesMLS
- $225,0003 bd2 ba1.1k sqftSunset Palm Villas, Miami, FL 33150For SaleMLS ID #B26041787, Robert W Eldredge, RWE Real Estate Services. BeachesMLS
- $230,0002 bd1 ba858 sqftBellcamp Manor, Miami, FL 33150For SaleMLS ID #A12010013, Yisel Montes, The Keyes Company. MIAMI
- $269,0003 bd2 ba1k sqftLakeview, Miami, FL 33167For SaleMLS ID #A11731220, Giovanni Bertolotti, Fausto Commercial Realty Consultants Inc. MIAMI
- $350,0003 bd1 ba985 sqftNew Liberty City, Miami, FL 33147For SaleMLS ID #A12074141, Alejandro Patino, Lexico Realty Inc. MIAMI
- $200,0003 bd2 ba1.1k sqftSunset Palm Villas Condo, Miami, FL 33150For SaleMLS ID #A12087974, Norma Fabri, Optimar International Realty. MIAMI
- $220,0003 bd2 ba1k sqftLakeview Estates, Miami, FL 33167For SaleMLS ID #A12116395, Debra Jay Daniels, Beachfront Realty Inc. MIAMI
- $299,0002 bd2 ba954 sqftShores Villas Condo Bldg, Miami, FL 33138For SaleMLS ID #A12066456, Cristina Di Giacomo, EXP Realty LLC. MIAMI
- $185,0002 bd1 ba950 sqftSunset Palm Villas Condo, Miami, FL 33150For SaleMLS ID #A12114649, Pablo Iojes, Universal USA Realty LLC. MIAMI
