Explore the investment potential at 889 S Willett Street! Offering approximately 2,164 square feet, this Memphis property presents an opportunity for investors looking to expand their portfolio or take on their next project. Bring your vision and evaluate the possibilities for your investment strategy. Schedule a showing today!
For sale
$75,000
889 S Willett St, Memphis, TN 38114
4beds
2,164sqft
Single Family Residence
Built in 1912
9,583 Square Feet Lot
$-- Zestimate®
$35/sqft
$-- HOA
What's special
- 4 days
- 148
- 10
Likely to sell faster than
Zillow last checked:
Listing updated:
Listed by:
Caleb Hall,
Keller Williams 901-221-5100
Source: MAAR,MLS#: 10232428
Facts & features
Interior
Bedrooms & bathrooms
- Bedrooms: 4
- Bathrooms: 2
- Full bathrooms: 2
Primary bedroom
- Width: 0
Dining room
- Width: 0
Living room
- Width: 0
Den
- Width: 0
Heating
- Other (See REMARKS)
Cooling
- Other (See REMARKS)
Features
- Other (See Remarks), Square Feet Source: AutoFill (MAARdata) or Public Records (Cnty Assessor Site)
- Number of fireplaces: 1
Interior area
- Total interior livable area: 2,164 sqft
Property
Parking
- Parking features: Other (See REMARKS)
Features
- Stories: 1.2
- Exterior features: Other (See REMARKS)
- Pool features: None
Lot
- Size: 9,583 Square Feet
- Dimensions: 60 x 165
- Features: Other (See Remarks)
Details
- Parcel number: 015027 00005
Construction
Type & style
- Home type: SingleFamily
- Architectural style: Contemporary
- Property subtype: Single Family Residence
Condition
- New construction: No
- Year built: 1912
Community & HOA
Community
- Subdivision: Brown & Fowlkes
Location
- Region: Memphis
Financial & listing details
- Price per square foot: $35/sqft
- Tax assessed value: $115,400
- Annual tax amount: $1,521
- Price range: $75K - $75K
- Date on market: 10/14/2026
- Cumulative days on market: 5 days
Estimated market value
Not available
Estimated sales range
Not available
$1,904/mo
Price history
| Date | Event | Price |
|---|---|---|
| 10/14/2026 | Listed for sale | $75,000-17.1%$35/sqft |
Source:  MAAR #10232428 Report a problem | ||
| 3/8/2024 | Sold | $90,500-2.7%$42/sqft |
Source: Public Record Report a problem | ||
| 2/1/2017 | Listing removed | $93,000$43/sqft |
Source: Vflyer Homes Report a problem | ||
| 1/29/2017 | Listed for sale | $93,000+447.1%$43/sqft |
Source: Vflyer Homes Report a problem | ||
| 9/2/2016 | Sold | $17,000-78.8%$8/sqft |
Source: MAAR #9971645 Report a problem | ||
| 2/26/2016 | Listing removed | $80,000$37/sqft |
Source: Owner Report a problem | ||
| 2/19/2016 | Listed for sale | $80,000+14.4%$37/sqft |
Source: Owner Report a problem | ||
| 1/18/2016 | Listing removed | $69,900$32/sqft |
Source: Owner Report a problem | ||
| 1/15/2016 | Price change | $69,900-17.8%$32/sqft |
Source: Owner Report a problem | ||
| 1/14/2016 | Price change | $85,000+18.1%$39/sqft |
Source: Owner Report a problem | ||
| 1/12/2016 | Price change | $72,000-28%$33/sqft |
Source: Owner Report a problem | ||
| 1/11/2016 | Listed for sale | $100,000+900%$46/sqft |
Source: Owner Report a problem | ||
| 11/24/2015 | Sold | $10,000-40.8%$5/sqft |
Source: Public Record Report a problem | ||
| 7/16/2015 | Listing removed | $16,900$8/sqft |
Source: Owner Report a problem | ||
| 6/30/2015 | Price change | $16,900-6.1%$8/sqft |
Source: Owner Report a problem | ||
| 6/23/2015 | Price change | $18,000-5.3%$8/sqft |
Source: Owner Report a problem | ||
| 6/17/2015 | Listed for sale | $19,000+90%$9/sqft |
Source: Owner Report a problem | ||
| 10/16/1996 | Sold | $10,000$5/sqft |
Source: Public Record Report a problem | ||
Public tax history
| Year | Property taxes | Tax assessment |
|---|---|---|
| 2025 | $1,521 +19.6% | $28,850 +49.5% |
| 2024 | $1,271 +8.1% | $19,300 |
| 2023 | $1,176 | $19,300 |
| 2022 | -- | $19,300 |
| 2021 | -- | $19,300 +50.2% |
| 2020 | $411 | $12,850 |
| 2019 | $411 -21.1% | $12,850 |
| 2018 | $520 -45.1% | $12,850 |
| 2017 | $949 +157.7% | $12,850 +18.7% |
| 2016 | $368 -4.6% | $10,825 |
| 2014 | $386 | $10,825 |
| 2013 | -- | $10,825 -10.5% |
| 2012 | -- | $12,100 |
| 2011 | -- | $12,100 |
| 2010 | -- | $12,100 |
| 2009 | -- | $12,100 -6.4% |
| 2008 | -- | $12,925 |
| 2007 | -- | $12,925 |
| 2006 | -- | $12,925 |
| 2005 | -- | $12,925 +106.8% |
| 2004 | -- | $6,250 |
| 2003 | -- | $6,250 |
| 2002 | -- | $6,250 -58.3% |
| 2001 | -- | $15,000 +122.2% |
| 2000 | -- | $6,750 |
Find assessor info on the county website
Monthly payment
Est. payment
Payment breakdown
Explore the cost of this home by adjusting the details. Changes won't be saved.Climate risks
Neighborhood: Midtown


Similar homes
- $75,0004 bd3 ba2k sqft2575 Rozelle St, Memphis, TN 38114For Sale
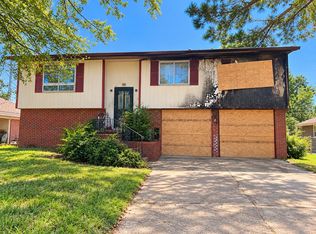 MLS ID #10232146, Tara A Woodley, Zach Taylor Real Estate. MAAR
- $--3 bd1 ba1.4k sqft3155 Kimball Ave, Memphis, TN 38114Auction
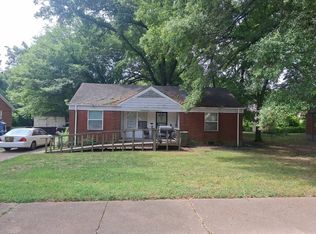 Auction.com 2
- $79,9003 bd1 ba1k sqft1037 Kyle St, Memphis, TN 38114For Sale
 MLS ID #10229064, H. Ben Strauch, Skyline Realty. MAAR
- $74,0006 bd4 ba2.6k sqft2174-2176 Carnes Ave, Memphis, TN 38114For Sale
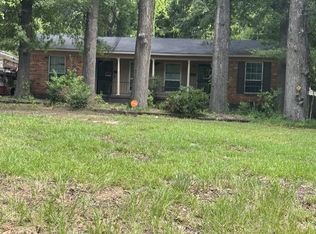 MLS ID #10230269, Pamela S Watson, Crye-Leike, Inc., REALTORS. MAAR
- $89,9004 bd2 ba2.3k sqft1570 E McLemore Ave, Memphis, TN 38106For Sale
 MLS ID #3543110, Christopher Mosby. RealTracs MLS as distributed by MLS GRID
- $80,0003 bd1 ba1.1k sqft1355 Doris Ave, Memphis, TN 38106For SaleMLS ID #3304551, Garth Ward. RealTracs MLS as distributed by MLS GRID
- $84,9005 bd2 ba2.1k sqft530 Marianna St, Memphis, TN 38111For SaleMLS ID #3312141, Christopher Mosby. RealTracs MLS as distributed by MLS GRID
