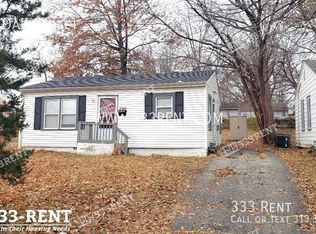
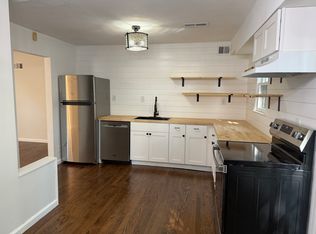
Bring all investors. Couldn't be a more opportune for short term rental. 480Square Foot. 50% of Estimated Value. 1Bed, 1 Bath. Deep Lot, and Gravel Drive. Hustle! Will not last! Home will require extensive remodel. To be sold in ASIS where IS condition. No Inspections.
Pending
$77,000
8906 Oak St, Kansas City, MO 64114
1beds
480sqft
Single Family Residence
Built in 1949
6,969 Square Feet Lot
$-- Zestimate®
$160/sqft
$-- HOA
What's special
Deep lotGravel drive
- 10 days
- 177
- 5
Likely to sell faster than
Zillow last checked:
Listing updated:
Listed by:
Jim Vogel 913-766-2812,
KW KANSAS CITY METRO
Source: Heartland MLS as distributed by MLS GRID,MLS#: 2648933
Facts & features
Interior
Bedrooms & bathrooms
- Bedrooms: 1
- Bathrooms: 1
- Full bathrooms: 1
Dining room
- Description: Breakfast Area
Heating
- Wall Furnace
Cooling
- None
Appliances
- Included: Refrigerator, Electric Range
- Laundry: None
Features
- Flooring: Wood
- Basement: Crawl Space
- Has fireplace: No
Interior area
- Total structure area: 480
- Total interior livable area: 480 sqft
- Finished area above ground: 480
- Finished area below ground: 0
Property
Parking
- Parking features: Off Street
Features
- Fencing: Metal
Lot
- Size: 6,969 Square Feet
- Dimensions: 50 x 139
Details
- Additional structures: Shed(s)
- Parcel number: 48230181800000000
Construction
Type & style
- Home type: SingleFamily
- Architectural style: Traditional
- Property subtype: Single Family Residence
Materials
- Frame
- Roof: Composition
Condition
- Year built: 1949
Utilities & green energy
- Sewer: Public Sewer
- Water: Public
Community & HOA
Community
- Subdivision: Other
HOA
- Has HOA: No
- HOA name: Boone
Location
- Region: Kansas City
Financial & listing details
- Price per square foot: $160/sqft
- Tax assessed value: $43,890
- Annual tax amount: $64,498
- Date on market: 10/26/2026
- Listing terms: Cash
- Ownership: Investor
Estimated market value
Not available
Estimated sales range
Not available
Not available
Price history
| Date | Event | Price |
|---|---|---|
| 10/28/2026 | Pending sale | $77,000$160/sqft |
Source:  Heartland MLS as distributed by MLS GRID #2648933 Report a problem | ||
| 10/26/2026 | Listed for sale | $77,000+6.2%$160/sqft |
Source: Heartland MLS as distributed by MLS GRID #2648933 Report a problem | ||
| 5/16/2023 | Listing removed | -- |
Source: Heartland MLS as distributed by MLS GRID #2425642 Report a problem | ||
| 5/1/2023 | Pending sale | $72,500$151/sqft |
Source: Heartland MLS as distributed by MLS GRID #2425642 Report a problem | ||
| 4/11/2023 | Price change | $72,500-3.3%$151/sqft |
Source: Heartland MLS as distributed by MLS GRID #2425642 Report a problem | ||
| 3/17/2023 | Listed for sale | $75,000$156/sqft |
Source: Heartland MLS as distributed by MLS GRID #2425642 Report a problem | ||
| 2/23/2021 | Listing removed | -- |
Source: Owner Report a problem | ||
| 9/28/2019 | Listing removed | $775$2/sqft |
Source: Owner Report a problem | ||
| 8/30/2019 | Listed for rent | $775+3.3%$2/sqft |
Source: Owner Report a problem | ||
| 10/26/2017 | Listing removed | $750$2/sqft |
Source: Owner Report a problem | ||
| 8/21/2017 | Price change | $750+15.4%$2/sqft |
Source: Owner Report a problem | ||
| 7/18/2017 | Listed for rent | $650$1/sqft |
Source: Owner Report a problem | ||
| 3/25/2016 | Listing removed | $650$1/sqft |
Source: Owner Report a problem | ||
| 2/18/2016 | Listed for rent | $650+8.3%$1/sqft |
Source: Owner Report a problem | ||
| 11/21/2015 | Listing removed | $600$1/sqft |
Source: Owner Report a problem | ||
| 11/6/2015 | Price change | $600-7.7%$1/sqft |
Source: Owner Report a problem | ||
| 6/3/2015 | Listed for rent | $650$1/sqft |
Source: Owner Report a problem | ||
Public tax history
| Year | Property taxes | Tax assessment |
|---|---|---|
| 2025 | $645 +15.2% | $8,340 +15% |
| 2024 | $560 +2.1% | $7,252 |
| 2023 | $549 -31% | $7,252 -20.5% |
| 2022 | $795 +0.3% | $9,120 |
| 2021 | $793 +5.4% | $9,120 +12.8% |
| 2020 | $752 +10.6% | $8,086 |
| 2019 | $680 | $8,086 +14.9% |
| 2018 | $680 -1.8% | $7,038 |
| 2017 | $693 +16.3% | $7,038 +13.9% |
| 2016 | $595 +0.9% | $6,179 +2% |
| 2014 | $590 -11.7% | $6,058 |
| 2013 | $668 +1.3% | $6,058 -11.6% |
| 2012 | $659 +8.7% | $6,850 |
| 2011 | $607 +0.8% | $6,850 |
| 2010 | $602 -1.9% | $6,850 |
| 2009 | $614 +0.2% | $6,850 -2% |
| 2008 | $613 +6.9% | $6,990 |
| 2007 | $573 +0.5% | $6,990 |
| 2006 | $570 +14.7% | $6,990 |
| 2005 | $497 +0.3% | $6,990 +15% |
| 2004 | $496 +14.2% | $6,078 |
| 2003 | $434 +5.3% | $6,078 +15% |
| 2002 | $412 +9.4% | $5,285 |
| 2001 | $377 | $5,285 |
Find assessor info on the county website
Monthly payment
Est. payment
Payment breakdown
Explore the cost of this home by adjusting the details. Changes won't be saved.Climate risks
Neighborhood: Bonne Hills
Nearby schools
Schools provided by the listing agent
- Elementary: Center
- Middle: Center
- High: Center
Source: Heartland MLS as distributed by MLS GRID. This data may not be complete. We recommend contacting the local school district to confirm school assignments for this home.

Similar homes
- $80,0002 bd1 ba672 sqft3716 Mersington Ave, Kansas City, MO 64128For Sale
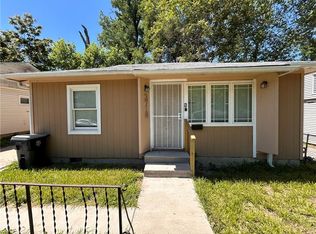 MLS ID #2624998, Kayla Clark, EXP Realty LLC. Heartland MLS as distributed by MLS GRID
- $75,0001 bd1 ba697 sqft8139 Holmes Rd APT 202, Kansas City, MO 64131For Sale
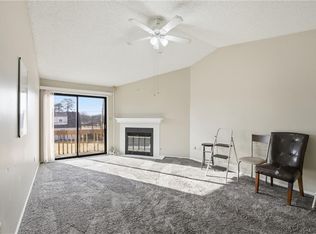 MLS ID #2632688, Samantha Salem, Platinum Realty LLC. Heartland MLS as distributed by MLS GRID
- $105,0002 bd1 ba606 sqft8034 Euclid Ave, Kansas City, MO 64132For Sale
 MLS ID #2646771, Homes By Brandy Team, Keller Williams Realty Partners Inc.. Heartland MLS as distributed by MLS GRID
- $79,0002 bd1 ba672 sqft3633 Norton Ave, Kansas City, MO 64127For Sale
 MLS ID #2584733, Christopher Kelly, EXP Realty LLC. Heartland MLS as distributed by MLS GRID
