This 2106 square foot single family home has 4 bedrooms and 3.0 bathrooms. This home is located at 8908 SW 151st Ct, Miami, FL 33196.
Pre-foreclosure
Est. $763,600
8908 SW 151st Ct, Miami, FL 33196
4beds
3baths
2,106sqft
SingleFamily
Built in 1984
6,799 Square Feet Lot
$763,600 Zestimate®
$363/sqft
$90/mo HOA
Overview
- 319 days
- 19
- 0
Facts & features
Interior
Bedrooms & bathrooms
- Bedrooms: 4
- Bathrooms: 3
Heating
- central, Electric
Cooling
- Central
Appliances
- Included: Dishwasher, Dryer, Microwave, Refrigerator, Washer
- Laundry: In Unit
Features
- Flooring: Tile
Interior area
- Total interior livable area: 2,106 sqft
Property
Parking
- Parking features: Off-street, Garage
Features
- Exterior features: Stucco
- Has spa: Yes
Lot
- Size: 6,799 Square Feet
- Features: Less Than 1/4 Acre Lot
Details
- Parcel number: 3059040060170
Construction
Type & style
- Home type: SingleFamily
Materials
- Roof: Tile
Condition
- Year built: 1984
Community & HOA
HOA
- Has HOA: Yes
- HOA fee: $90 monthly
Location
- Region: Miami
Financial & listing details
- Price per square foot: $363/sqft
- Tax assessed value: $597,805
- Annual tax amount: $10,860
Foreclosure details
Estimated market value
$763,600
$725,000 - $802,000
$4,066/mo
Price history
| Date | Event | Price |
|---|---|---|
| 9/26/2023 | Sold | $700,000-2.8%$332/sqft |
Source:  MIAMI #A11334040 Report a problem | ||
| 8/16/2023 | Contingent | $720,000$342/sqft |
Source: MIAMI #A11334040 Report a problem | ||
| 8/14/2023 | Listed for sale | $720,000$342/sqft |
Source: MIAMI #A11334040 Report a problem | ||
| 8/2/2023 | Contingent | $720,000$342/sqft |
Source: MIAMI #A11334040 Report a problem | ||
| 8/2/2023 | Price change | $720,000-9.9%$342/sqft |
Source: MIAMI #A11334040 Report a problem | ||
| 6/12/2023 | Pending sale | $799,000$379/sqft |
Source: MIAMI #A11334040 Report a problem | ||
| 5/3/2023 | Listed for sale | $799,000$379/sqft |
Source: MIAMI #A11334040 Report a problem | ||
| 4/21/2023 | Listing removed | -- |
Source: MIAMI #A11369079 Report a problem | ||
| 4/21/2023 | Pending sale | $799,000$379/sqft |
Source: MIAMI #A11334040 Report a problem | ||
| 4/14/2023 | Listed for rent | $6,000$3/sqft |
Source: MIAMI #A11369079 Report a problem | ||
| 4/14/2023 | Listing removed | -- |
Source: MIAMI #A11369081 Report a problem | ||
| 4/8/2023 | Listed for rent | $6,000$3/sqft |
Source: MIAMI #A11369081 Report a problem | ||
| 1/27/2023 | Listed for sale | $799,000$379/sqft |
Source: MIAMI #A11334040 Report a problem | ||
| 12/28/2022 | Listing removed | -- |
Source: MIAMI #A11239693 Report a problem | ||
| 7/12/2022 | Listed for sale | $799,000-0.1%$379/sqft |
Source: MIAMI #A11239693 Report a problem | ||
| 6/29/2022 | Listing removed | -- |
Source: MIAMI #A11221622 Report a problem | ||
| 6/13/2022 | Listed for sale | $799,900+135.3%$380/sqft |
Source: MIAMI #A11221622 Report a problem | ||
| 5/11/2016 | Sold | $340,000-2.9%$161/sqft |
Source: Public Record Report a problem | ||
| 2/19/2016 | Listed for sale | $350,000-6.7%$166/sqft |
Source: Homes by Ivon.com #A2078425 Report a problem | ||
| 6/5/2015 | Listing removed | $375,000$178/sqft |
Source: Homes by Ivon.com #A2078425 Report a problem | ||
| 5/21/2015 | Price change | $375,000-1.3%$178/sqft |
Source: Homes by Ivon.com #A2078425 Report a problem | ||
| 4/30/2015 | Listed for sale | $380,000+15.2%$180/sqft |
Source: Homes by Ivon.com #A2078425 Report a problem | ||
| 1/6/2014 | Sold | $330,000-5.7%$157/sqft |
Source: Public Record Report a problem | ||
| 11/13/2013 | Listed for sale | $350,000+112.1%$166/sqft |
Source: Real Estate Sales Force Report a problem | ||
| 5/8/2011 | Listing removed | $165,000-2.9%$78/sqft |
Source: Vflyer Homes #M1480581 Report a problem | ||
| 5/6/2011 | Sold | $170,000+17.7%$81/sqft |
Source: Public Record Report a problem | ||
| 9/9/2010 | Sold | $144,400-58.7%$69/sqft |
Source: Public Record Report a problem | ||
| 10/5/2005 | Sold | $350,000+133.5%$166/sqft |
Source: Public Record Report a problem | ||
| 10/26/2000 | Sold | $149,900$71/sqft |
Source: Public Record Report a problem | ||
Public tax history
| Year | Property taxes | Tax assessment |
|---|---|---|
| 2025 | $10,860 -3% | $597,805 -3.1% |
| 2024 | $11,193 +27.3% | $617,143 +28.4% |
| 2023 | $8,790 +11.1% | $480,614 +11.3% |
| 2022 | $7,912 +57.8% | $431,644 +46.2% |
| 2021 | $5,014 +1.1% | $295,269 +1.4% |
| 2020 | $4,958 +2.1% | $291,193 +2.3% |
| 2019 | $4,854 +4.9% | $284,647 +1.9% |
| 2018 | $4,629 | $279,340 +1.7% |
| 2017 | $4,629 +0.1% | $274,539 +46.9% |
| 2016 | $4,625 +48% | $186,834 +0.7% |
| 2015 | $3,125 -1.2% | $185,536 +0.8% |
| 2014 | $3,164 +16.9% | $184,064 +6.4% |
| 2013 | $2,706 | $173,033 +7.7% |
| 2012 | $2,706 -22.3% | $160,612 -0.4% |
| 2011 | $3,483 -17% | $161,316 -11.8% |
| 2010 | $4,198 -21.6% | $182,849 -29.5% |
| 2009 | $5,354 -17% | $259,253 -19.6% |
| 2007 | $6,450 +40.2% | $322,617 |
| 2006 | $4,601 | -- |
| 2005 | $4,601 +18.5% | -- |
| 2004 | $3,881 +16.6% | -- |
| 2003 | $3,330 +20.6% | -- |
| 2002 | $2,761 | -- |
| 2001 | $2,761 | -- |
Find assessor info on the county website
Monthly payment
Climate risks
Neighborhood: 33196


Similar homes
- $820,0004 bd3 ba2.5k sqftWeitzer Hammocks Homes Se, Miami, FL 33196New Construction
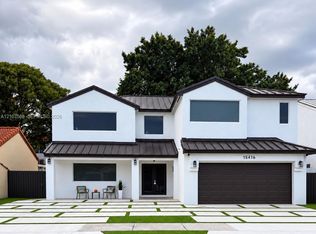
 MLS ID #A12107568, Osmany Fuenteseca, Fuenteseca Properties, LLC.. MIAMI
- $764,5004 bd2 ba2.1k sqftSunfish At The Hammocks, Miami, FL 33196For Sale
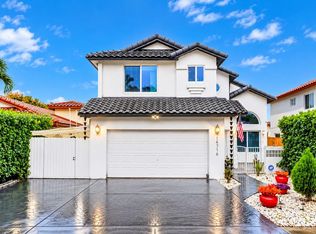 MLS ID #A12102713, Felix Olivera, Nexus One Realty. MIAMI
- $690,0004 bd3 ba2.3k sqftForest Lakes Estates Sec, Miami, FL 33196For Sale
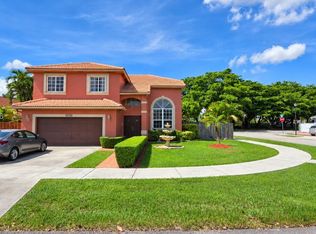 MLS ID #A12101498, Mario Avalos, K & A Realty. MIAMI
- $795,0004 bd3 ba2.8k sqftHighlands At Kendall 1st, Miami, FL 33196For Sale
 MLS ID #A12044435, Irving Zamora, Homes 4 You, Inc. MIAMI
- $685,0003 bd3 ba1.9k sqftPeral Sub, Miami, FL 33196For SaleMLS ID #A12096768, Clarice Almeida, Realty One Group Plus. MIAMI
- $649,9994 bd3 ba2.5k sqftHammocks Sec 1, Miami, FL 33196For SaleMLS ID #A11905434, Maylet Vazquez, EXP Realty LLC. MIAMI
- $780,0004 bd3 ba2.5k sqftKendall Commons Residenti, Palmetto Bay, FL 33196For SaleMLS ID #A12098075, Lucia Jimenez, Inmobiliata, LLC. MIAMI
- $710,0004 bd3 ba2.7k sqftSunnyview Sub, Miami, FL 33196For SaleMLS ID #A12042939, Anthony Valenzuela, The Valenzuela Real Estate Group. MIAMI
- $705,0004 bd3 ba2.2k sqftLive Oak Of The Hammocks, Miami, FL 33196For SaleMLS ID #A12070654, Michael Mireles, Miami Realty Dreams Inc.. MIAMI
- $779,9005 bd3 ba2.6k sqftForest Lakes Estates Sec, Miami, FL 33196For SaleMLS ID #A12087466, Luis Ponce, The Keyes Company. MIAMI
- $780,0004 bd3 ba2.8k sqftJasmine At The Hammocks 1, Miami, FL 33196For SaleMLS ID #A12064249, Jennifer Betancourt, Legacy Group Real Estate, LLC.. MIAMI
- $669,0003 bd2 ba2k sqftHammocks Sec 1, Miami, FL 33196For SaleMLS ID #A12085705, Frank Pulles, Coldwell Banker Realty. MIAMI
- $675,0004 bd2 ba1.9k sqftParcel G At Lago Mar, Miami, FL 33193For SaleMLS ID #A12108172, Anthony Askowitz, RE/MAX Advance Realty II. MIAMI
- $799,0004 bd2 ba2.2k sqftLakeside At The Hammocks, Miami, FL 33196For SaleMLS ID #A12015661, Michael Garcia, Direct Realty Solutions. MIAMI
- $679,0004 bd3 ba2k sqftPeral Sub, Miami, FL 33196For SaleMLS ID #A12055970, Lawrence Salas, Bestway Realty Sales, LLC. MIAMI
- $719,0003 bd3 ba1.8k sqftWeitzer Hammocks Homes Se, Miami, FL 33196For SaleMLS ID #A12087741, Angela Perera, Innovations Realty, Inc.. MIAMI
- $795,0004 bd3 ba2.8k sqftJasmine At The Hammocks 1, Miami, FL 33196For SaleMLS ID #A11992231, Gianni Perocarpi, Coldwell Banker Realty. MIAMI
- $625,0003 bd3 ba1.4k sqftPanache Sec 3, Miami, FL 33196For SaleMLS ID #A12105000, Carlos Serra, Royal Experience Realty Group. MIAMI
- $664,9003 bd2 ba1.7k sqftHammocks Sec 3, Miami, FL 33196For SaleMLS ID #A12004001, Fabrizio Quintana, London Foster Realty. MIAMI
- $674,9004 bd3 ba1.8k sqftVizcaya At The Hammocks 1, Miami, FL 33196For SaleMLS ID #A12062352, Steven Dickson Kremer, Rush Properties. MIAMI
