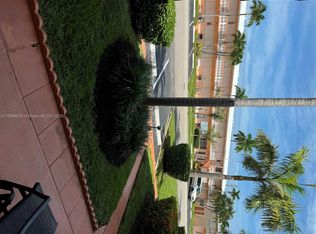
nice condo all renovated ,new appliances ,new furniture all inclued . good access from I-95 .close to aventura shopping center . minutes away from beach ,restaurant ..
For sale
$94,900
900 SW 11th Ave APT 4C, Hallandale, FL 33009
1beds
625sqft
Stock Cooperative
Built in 1962
-- sqft lot
$-- Zestimate®
$152/sqft
$346/mo HOA
What's special
New appliances
- 11 days
- 67
- 6
Likely to sell faster than
Zillow last checked:
Listing updated:
Listed by:
Jean Hebert 954-849-7669,
Dalton Wade Inc
Source: MIAMI,MLS#: A12117266 Originating MLS: A-Miami Association of REALTORS
Facts & features
Interior
Bedrooms & bathrooms
- Bedrooms: 1
- Bathrooms: 1
- Full bathrooms: 1
Heating
- Electric
Cooling
- Ceiling Fan(s), Electric
Appliances
- Included: Electric Range, Electric Water Heater, Refrigerator
- Laundry: Common Area
Features
- Flooring: Ceramic Tile
- Windows: Hurricane Shutters
Interior area
- Total structure area: 625
- Total interior livable area: 625 sqft
Video & virtual tour
Property
Parking
- Parking features: 1 Space, Additional Spaces Available
Features
- Entry location: First Floor Entry
- Exterior features: Barbecue, Courtyard
- Pool features: Association
- Has view: Yes
- View description: Garden, Other, Water
- Has water view: Yes
- Water view: Water
Details
- Parcel number: 514228NR0440
Construction
Type & style
- Home type: Cooperative
- Property subtype: Stock Cooperative
- Attached to another structure: Yes
Materials
- Concrete Block Construction
Condition
- Completely Renovated
- Year built: 1962
Utilities & green energy
- Electric: Circuit Breakers
Community & HOA
Community
- Security: Other
- Application fee: $150
- Senior community: Yes
- Subdivision: Rolen Lake Gardens Co-Op
HOA
- Has HOA: Yes
- Amenities included: Barbecue, Clubhouse-Clubroom, Pool, Shuffleboard Court
- HOA fee: $346 monthly
Location
- Region: Hallandale
Financial & listing details
- Price per square foot: $152/sqft
- Tax assessed value: $86,480
- Annual tax amount: $2,136
- Date on market: 11/3/2026
- Listing terms: All Cash
Estimated market value
Not available
Estimated sales range
Not available
Not available
Price history
| Date | Event | Price |
|---|---|---|
| 11/3/2026 | Listed for sale | $94,900+5.6%$152/sqft |
Source:  MIAMI #A12117266 Report a problem | ||
| 7/2/2026 | Listing removed | $89,900$144/sqft |
Source: MIAMI #A11952087 Report a problem | ||
| 3/13/2026 | Price change | $89,900-5.4%$144/sqft |
Source: MIAMI #A11952087 Report a problem | ||
| 2/23/2026 | Price change | $94,995+5.6%$152/sqft |
Source: MIAMI #A11952087 Report a problem | ||
| 1/29/2026 | Price change | $89,995-5.2%$144/sqft |
Source: MIAMI #A11952087 Report a problem | ||
| 1/24/2026 | Listed for sale | $94,900+46%$152/sqft |
Source: MIAMI #A11952087 Report a problem | ||
| 1/22/2026 | Sold | $65,000-4.4%$104/sqft |
Source: MIAMI #A11834286 Report a problem | ||
| 11/19/2025 | Price change | $68,000-13.9%$109/sqft |
Source: MIAMI #A11834286 Report a problem | ||
| 7/3/2025 | Listed for sale | $79,000-12.1%$126/sqft |
Source: MIAMI #A11834286 Report a problem | ||
| 7/1/2025 | Listing removed | $89,900$144/sqft |
Source: MIAMI #A11741418 Report a problem | ||
| 2/8/2025 | Listed for sale | $89,900$144/sqft |
Source: MIAMI #A11741418 Report a problem | ||
Public tax history
| Year | Property taxes | Tax assessment |
|---|---|---|
| 2025 | $2,136 -0.5% | $86,480 +0.5% |
| 2024 | $2,147 +29.4% | $86,070 +39.2% |
| 2023 | $1,660 +13.2% | $61,830 +10% |
| 2022 | $1,466 +9.5% | $56,210 +7.6% |
| 2021 | $1,339 +2.8% | $52,260 +4.4% |
| 2020 | $1,303 +7.7% | $50,060 +10% |
| 2019 | $1,209 | $45,510 +5% |
| 2018 | $1,209 +9.2% | $43,360 +4% |
| 2017 | $1,108 +11.9% | $41,710 +0% |
| 2016 | $990 -1.6% | $41,690 -4.8% |
| 2015 | $1,006 +1.4% | $43,770 +1.4% |
| 2014 | $992 | $43,150 +10% |
| 2013 | $992 +1.5% | $39,230 -4.5% |
| 2012 | $977 +0.6% | $41,100 -4% |
| 2011 | $972 +6.7% | $42,830 +17.1% |
| 2010 | $911 -22% | $36,560 -26.1% |
| 2009 | $1,168 +7.8% | $49,470 +0.1% |
| 2008 | $1,083 | $49,440 |
Find assessor info on the county website
Monthly payment
Est. payment
Payment breakdown
Explore the cost of this home by adjusting the details. Changes won't be saved.Climate risks
Neighborhood: 33009
- $94,5001 bd1 ba625 sqft900 SW 11th Ave APT 7C, Hallandale Beach, FL 33009For Sale

- $124,9001 bd1 ba625 sqft900 SW 11th Ave APT 8, Hallandale, FL 33009For Sale

- $99,0001 bd1 ba625 sqft900 SW 11th Ave APT 8C, Hallandale, FL 33009Sold
- $1,5001 bd1 ba625 sqft900 SW 11th Ave APT 12A, Hallandale, FL 33009For Rent

Similar homes
- $99,9001 bd1 ba625 sqftRolen Lake Gardens Co-Op, Hallandale, FL 33009For Sale

 MLS ID #A12119368, Robin Fractenberg, Coldwell Banker Realty. MIAMI
- $94,5001 bd1 ba625 sqftRolen Lake Gardens, Hallandale Beach, FL 33009For SaleMLS ID #A12084827, Carmen Siles, New Emporium Properties, Inc.. MIAMI
- $124,9001 bd1 ba625 sqftRolen Lake, Hallandale, FL 33009For SaleMLS ID #A12117979, Jean Hebert, Dalton Wade Inc. MIAMI
- $94,5001 bd1 ba600 sqftDiplomat Garden, Hallandale Beach, FL 33009For Sale
 MLS ID #A12098536, Nanette Davidson Jackson, London Foster Realty. MIAMI
- $116,0001 bd1 ba625 sqftRolen Lake Gradens, Hallandale, FL 33009For SaleMLS ID #A12090403, Louise Daigle, Florida Homes Realty & Mortgag. MIAMI
- $94,9001 bd1 ba785 sqftBerkeley Diplomat Co-Op, Hallandale, FL 33009For SaleMLS ID #A12012651, Patricia Masi, Macken Realty Inc. MIAMI
- $125,0001 bd1 ba770 sqftFirst Gulfstream Garden, Hallandale, FL 33009For SaleMLS ID #A11982246, Sunday Mixon, London Foster Realty. MIAMI
- $125,0001 bd2 ba770 sqftFirst Gulfstream Garden, Hallandale, FL 33009For SaleMLS ID #A12103203, Viktoriia Lingenfelser, Brown Harris Stevens. MIAMI
- $82,0001 bd1 ba688 sqftMar-Len Gardens, North Miami Beach, FL 33162For SaleMLS ID #A12120659, Anibal Jorge, JJ Gold Realty LLC. MIAMI
- $100,0001 bd1 ba692 sqftRo-Mont South Condo, Miami Gardens, FL 33179For SaleMLS ID #A12048701, Leopold Evariste, LEO Realty, Inc.. MIAMI
- $94,5001 bd2 ba597 sqftSanta Monica Condominium, Hollywood, FL 33020For SaleMLS ID #A11971060, Teresita Dietz, Black Ivy Realty. MIAMI
- $125,0001 bd1 ba320 sqftDiplomat Golf & Raquet Cl, Hallandale, FL 33009For SaleMLS ID #A12100316, Anatoly Glazer, GBA Properties, Inc.. MIAMI
- $105,0001 bd1 ba575 sqftRo-Mont Gardens Andover B, Miami Gardens, FL 33169For SaleMLS ID #A11954450, Roberto Oms, Maverick Real Estate Associates Florida. MIAMI
- $100,000-- bd-- ba725 sqftCoronado Towers, North Miami, FL 33161For SaleMLS ID #A12077531, Rama Vyasulu, Homes Real Estate Group Inc.. MIAMI
- $79,5001 bd2 ba720 sqftBeverly Hills Condo, Hollywood, FL 33021For SaleMLS ID #A11979929, Arelis Marquez, A Garcia Realty, LLC. MIAMI
- $115,0001 bd1 ba692 sqftRo-Mont South Condo K, Miami Gardens, FL 33179For SaleMLS ID #A12010574, Stephanie Cives, Coldwell Banker Realty. MIAMI
- $110,0001 bd2 ba790 sqftCrestview Towers, North Miami Beach, FL 33162For SaleMLS ID #A11842921, Karina Sobrino, Optimar International Realty. MIAMI
- $125,0001 bd1 ba691 sqftRo-Mont South Condo E, Miami, FL 33179For SaleMLS ID #A12071960, Karla Ruiz, Black Swan Home Group LLC. MIAMI
- $130,0002 bd2 ba928 sqftCapri Gardens Condo, North Miami, FL 33161For SaleMLS ID #A12114671, Stephanie Agledor, Vylla Home. MIAMI
