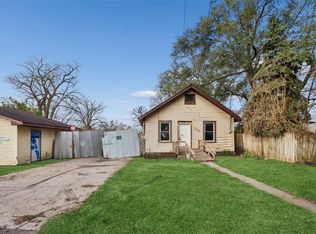
This property is an excellent investment opportunity for rental, fix a bit and flip, or make it your own. Convenient location, sensible floorplan, nice side yard, and tons of instant equity make this winter project very worthwhile!! Yes, clean out, repairs and updates are needed, but the bargain price reflects that. Don't let this great opportunity get away- call today!!
Pending
$36,500
907 Buchanan St, Des Moines, IA 50316
3beds
1,081sqft
Single Family Residence
Built in 1885
2,613 Square Feet Lot
$-- Zestimate®
$34/sqft
$-- HOA
What's special
Sensible floorplanNice side yard
- 21 days
- 760
- 57
Likely to sell faster than
Zillow last checked:
Listing updated:
Listed by:
Dave Wiges 712-263-4694,
McCord Insurance & Real Estate
Source: NoCoast MLS as distributed by MLS GRID,MLS#: 6344165
Facts & features
Interior
Bedrooms & bathrooms
- Bedrooms: 3
- Bathrooms: 1
- Full bathrooms: 1
Heating
- Forced Air
Cooling
- Window Unit(s)
Features
- Basement: Partial
Interior area
- Total interior livable area: 1,081 sqft
- Finished area above ground: 1,081
- Finished area below ground: 0
Property
Parking
- Parking features: Concrete
Accessibility
- Accessibility features: None
Features
- Levels: Two
Lot
- Size: 2,613 Square Feet
- Dimensions: 50 x 50
Details
- Parcel number: 040/02241000000
Construction
Type & style
- Home type: SingleFamily
- Property subtype: Single Family Residence
Materials
- HardiPlank Type
Condition
- Year built: 1885
Utilities & green energy
- Sewer: Public Sewer
- Water: Public
Community & HOA
Community
- Subdivision: GENESERS ADD
HOA
- Has HOA: No
Location
- Region: Des Moines
Financial & listing details
- Price per square foot: $34/sqft
- Tax assessed value: $78,000
- Annual tax amount: $1,470
- Date on market: 10/30/2026
- Cumulative days on market: 20 days
Estimated market value
Not available
Estimated sales range
Not available
Not available
Price history
| Date | Event | Price |
|---|---|---|
| 11/16/2026 | Pending sale | $36,500$34/sqft |
Source:  NoCoast MLS as distributed by MLS GRID #6344165 Report a problem | ||
| 10/30/2026 | Listed for sale | $36,500+6417.9%$34/sqft |
Source: NoCoast MLS as distributed by MLS GRID #6344165 Report a problem | ||
| 10/1/2026 | Sold | $560-96.7%$1/sqft |
Source: Public Record Report a problem | ||
| 11/19/1999 | Sold | $17,000$16/sqft |
Source: Public Record Report a problem | ||
Public tax history
| Year | Property taxes | Tax assessment |
|---|---|---|
| 2025 | $4,375 +10.4% | $78,000 +16.2% |
| 2024 | $3,964 +286.4% | $67,100 |
| 2023 | $1,026 +1% | $67,100 +28.1% |
| 2022 | $1,016 -86.5% | $52,400 |
| 2021 | $7,525 +443% | $52,400 +14.7% |
| 2020 | $1,386 -71.8% | $45,700 |
| 2019 | $4,907 +23.9% | $45,700 +4.3% |
| 2018 | $3,959 +2284.6% | $43,800 |
| 2017 | $166 +76.6% | $43,800 +5.5% |
| 2016 | $94 | $41,500 |
| 2015 | $94 -66.7% | $41,500 -6.1% |
| 2014 | $282 | $44,200 |
| 2013 | -- | $44,200 +0.2% |
| 2012 | -- | $44,100 |
| 2011 | -- | $44,100 +11.1% |
| 2010 | -- | $39,700 |
| 2009 | -- | $39,700 +3.4% |
| 2008 | -- | $38,400 |
| 2007 | -- | $38,400 -1.3% |
| 2006 | -- | $38,900 |
| 2005 | -- | $38,900 +13.8% |
| 2003 | -- | $34,170 +35.4% |
| 2002 | -- | $25,230 |
| 2001 | -- | $25,230 |
Find assessor info on the county website
Monthly payment
Est. payment
Payment breakdown
Explore the cost of this home by adjusting the details. Changes won't be saved.Climate risks
Neighborhood: Capitol Park

Similar homes
- $49,9002 bd1 ba696 sqft734 SE 25th St, Des Moines, IA 50317Auction
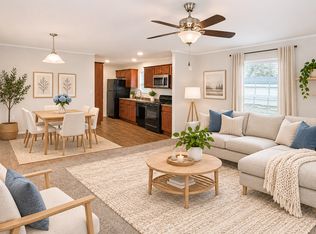
 MLS ID #753110, STEVEN CAMERONA, Iowa Realty Beaverdale. DMMLS
- $39,9003 bd2 ba1.2k sqft1921 SE Winter Park Dr, Ankeny, IA 50021New Construction
 Autumn Ridge
- $31,9003 bd2 ba960 sqft6901 SE 14th St #75, Des Moines, IA 50320For Sale
 MLS ID #202604745, Joanne Stevens. Iowa City Area AOR
- $29,0002 bd2 ba909 sqft6901 SE 14th St Lot 30, Des Moines, IA 50320For Sale
 MLS ID #202605169, Joanne Stevens. Iowa City Area AOR
