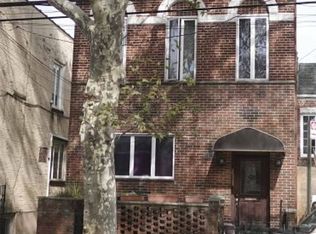
Semi-detached brick 3 family, building 21X67, lot 25.5X100. Share driveway, finished basement. 3 heats and 3 boilers.
For sale
$2,200,000
911 48th St, Brooklyn, NY 11219
6beds
2,680sqft
Multi Family
Built in 1925
-- sqft lot
$2,114,300 Zestimate®
$821/sqft
$-- HOA
What's special
Finished basement
- 706 days
- 251
- 7
Zillow last checked:
Listing updated:
Listed by:
Tiger Realty 917-708-9966,
Hang (Tyler) Chen 646-239-5999
Source: BNYMLS,MLS#: 488071
Facts & features
Interior
Bedrooms & bathrooms
- Bedrooms: 6
- Bathrooms: 4
- Full bathrooms: 3
- 1/2 bathrooms: 1
Heating
- Natural Gas, Hot Water
Cooling
- Has cooling: Yes
Appliances
- Included: Refrigerator, Stove, Gas Water Heater
Features
- Flooring: Tile, Other
- Basement: Finished,Full
Interior area
- Total structure area: 2,680
- Total interior livable area: 2,680 sqft
Property
Parking
- Total spaces: 2
- Parking features: Shared Drive, 2 Spaces
- Has uncovered spaces: Yes
Features
- Stories: 2
Lot
- Size: 2,504 Square Feet
- Dimensions: 25x100
- Features: Back Yard
Details
- Foundation area: 1407
- Parcel number: 056250075
- Zoning: R6
- Special conditions: Arm's Length
Construction
Type & style
- Home type: MultiFamily
- Property subtype: Multi Family
- Attached to another structure: Yes
Materials
- Brick
- Foundation: Concrete Perimeter
- Roof: Flat
Condition
- Year built: 1925
Utilities & green energy
- Electric: 110 V
Community & HOA
Community
- Subdivision: Brooklyn
Location
- Region: Brooklyn
Financial & listing details
- Price per square foot: $821/sqft
- Tax assessed value: $1,807,000
- Annual tax amount: $11,315
- Date on market: 12/14/2024
- Cumulative days on market: 1903 days
Estimated market value
$2,114,300
$2.01M - $2.22M
$2,930/mo
Price history
| Date | Event | Price |
|---|---|---|
| 12/14/2024 | Price change | $2,200,000+4.8%$821/sqft |
Source:  BNYMLS #488071 Report a problem | ||
| 10/11/2024 | Price change | $2,100,000-4.5%$784/sqft |
Source: StreetEasy #S1629198 Report a problem | ||
| 5/6/2024 | Listed for sale | $2,200,000+4.8%$821/sqft |
Source: BNYMLS #455042 Report a problem | ||
| 11/10/2023 | Listing removed | -- |
Source: StreetEasy Report a problem | ||
| 4/4/2022 | Price change | $2,100,000-3.7%$784/sqft |
Source:  RE/MAX International #455042 Report a problem | ||
| 3/2/2022 | Price change | $2,180,000+3.8%$813/sqft |
Source: StreetEasy Report a problem | ||
| 1/4/2022 | Price change | $2,100,000-3.7%$784/sqft |
Source: BNYMLS #455042 Report a problem | ||
| 8/27/2021 | Listed for sale | $2,180,000+440.9%$813/sqft |
Source: RE/MAX International #455042 Report a problem | ||
| 2/22/2001 | Sold | $403,000$150/sqft |
Source: Public Record Report a problem | ||
Public tax history
| Year | Property taxes | Tax assessment |
|---|---|---|
| 2025 | $11,849 +4.7% | $108,420 +9.8% |
| 2024 | $11,315 | $98,760 -5.3% |
| 2023 | -- | $104,340 +22.2% |
| 2022 | -- | $85,380 -1.3% |
| 2021 | -- | $86,520 -17.5% |
| 2020 | $10,533 +6% | $104,880 +6.4% |
| 2019 | $9,937 +7.3% | $98,580 +122.6% |
| 2018 | $9,265 +5.4% | $44,290 +2.7% |
| 2017 | $8,792 +4.2% | $43,130 |
| 2016 | $8,434 | $43,130 +4% |
| 2015 | $8,434 +71.9% | $41,468 +6% |
| 2014 | $4,907 | $39,122 +6% |
| 2013 | -- | $36,909 +2.7% |
| 2012 | -- | $35,942 |
| 2011 | -- | $35,942 +4% |
| 2010 | -- | $34,557 +6% |
| 2009 | -- | $32,602 +6% |
| 2008 | -- | $30,758 +2.7% |
| 2007 | -- | $29,952 |
| 2006 | -- | $29,952 +4% |
| 2005 | -- | $28,798 +6% |
| 2004 | -- | $27,169 +6% |
| 2003 | -- | $25,632 +2.7% |
| 2002 | -- | $24,960 |
| 2001 | -- | $24,960 +4% |
| 2000 | -- | $23,999 |
Find assessor info on the county website
Monthly payment
Climate risks
Neighborhood: Borough Park


Similar homes
- $2,600,0007 bd3 ba2.4k sqft939 58th St, Brooklyn, NY 11219For Sale
 MLS ID #499196, Jason Zhou, Listing by: RE/MAX Edge. BNYMLS
- $2,500,0004 bd5 ba3.1k sqft3514 12th Ave, Brooklyn, NY 11218Active
 MLS ID #S1858150, Theo Bacon, Listing by: Renaissance Realty Group I LLC. StreetEasy
- $1,999,9998 bd4 ba2.1k sqft819 52nd St, Brooklyn, NY 11220For Sale
 MLS ID #505546, Jing Sui Lin, Listing by: Tiger Realty. BNYMLS
- $2,600,0007 bd3 ba2k sqft935 58th St, Brooklyn, NY 11219For Sale
 MLS ID #499194, Jason Zhou, Listing by: RE/MAX Edge. BNYMLS
