This 2212 square foot single family home has 3 bedrooms and 2.5 bathrooms. This home is located at 9118 W Vernon Ave, Phoenix, AZ 85037.
Pre-foreclosure
Est. $373,400
9118 W Vernon Ave, Phoenix, AZ 85037
3beds
2baths
2,212sqft
SingleFamily
Built in 2005
5,174 Square Feet Lot
$373,400 Zestimate®
$169/sqft
$46/mo HOA
Overview
- 100 days
- 66
- 0
Facts & features
Interior
Bedrooms & bathrooms
- Bedrooms: 3
- Bathrooms: 2.5
Heating
- Other, Electric, Gas
Cooling
- Refrigerator
Appliances
- Included: Dishwasher, Microwave, Range / Oven
- Laundry: Inside Laundry, Wshr/Dry HookUp Only, 220 V Dryer Hookup
Features
- Flooring: Carpet, Linoleum / Vinyl
Interior area
- Total interior livable area: 2,212 sqft
Property
Parking
- Total spaces: 4
- Parking features: Garage - Attached
Features
- Exterior features: Stucco
- Fencing: Block
Lot
- Size: 5,174 Square Feet
Details
- Parcel number: 10234755
Construction
Type & style
- Home type: SingleFamily
Materials
- Roof: Other
Condition
- Year built: 2005
Utilities & green energy
- Sewer: Sewer - Public
- Utilities for property: SRP, SW Gas
Community & HOA
HOA
- Has HOA: Yes
- HOA fee: $46 monthly
Location
- Region: Phoenix
Financial & listing details
- Price per square foot: $169/sqft
- Tax assessed value: $316,200
- Annual tax amount: $1,868
- Ownership: Fee Simple
Foreclosure details
Estimated market value
$373,400
$355,000 - $392,000
$2,169/mo
Price history
| Date | Event | Price |
|---|---|---|
| 12/20/2019 | Sold | $270,000-6.6%$122/sqft |
Source:  ARMLS #5954957 Report a problem | ||
| 10/15/2019 | Price change | $289,000-3%$131/sqft |
Source: DenMar Realty #5954957 Report a problem | ||
| 9/19/2019 | Price change | $298,000-2.3%$135/sqft |
Source: DenMar Realty #5954957 Report a problem | ||
| 8/30/2019 | Price change | $305,000-3.2%$138/sqft |
Source: DenMar Realty #5954957 Report a problem | ||
| 7/20/2019 | Listed for sale | $315,000+63.2%$142/sqft |
Source: DenMar Realty #5954957 Report a problem | ||
| 11/14/2016 | Sold | $193,000-5.8%$87/sqft |
Source: ARMLS #5507103 Report a problem | ||
| 10/6/2016 | Listed for sale | $204,900+76.9%$93/sqft |
Source: Liberty Properties & Associate #5507103 Report a problem | ||
| 7/25/2014 | Listing removed | $1,100 |
Source: Metropolitan Real Estate #5147409 Report a problem | ||
| 7/22/2014 | Listed for rent | $1,100+10.6% |
Source: Metropolitan Real Estate #5147409 Report a problem | ||
| 5/17/2013 | Listing removed | $995 |
Source: Metropolitan Real Estate #4925688 Report a problem | ||
| 4/5/2013 | Price change | $995-4.8% |
Source: Golba Group Property Management Report a problem | ||
| 3/21/2013 | Price change | $1,045-4.6% |
Source: Golba Group Property Management Report a problem | ||
| 3/1/2013 | Price change | $1,095-3.9% |
Source: Golba Group Property Management Report a problem | ||
| 1/10/2013 | Listed for rent | $1,140$1/sqft |
Source: Hotpads for Rent Report a problem | ||
| 1/9/2013 | Sold | $115,800-46.1%$52/sqft |
Source: Public Record Report a problem | ||
| 6/23/2005 | Sold | $214,934$97/sqft |
Source: Public Record Report a problem | ||
Public tax history
| Year | Property taxes | Tax assessment |
|---|---|---|
| 2025 | $1,868 +15.4% | $31,620 -5.7% |
| 2024 | $1,618 -2.3% | $33,520 +163% |
| 2023 | $1,656 +2.4% | $12,747 -42.3% |
| 2022 | $1,617 +7.3% | $22,110 +9.9% |
| 2021 | $1,507 -11% | $20,120 +9.2% |
| 2020 | $1,694 +9.3% | $18,430 +9.9% |
| 2019 | $1,549 | $16,770 +6.5% |
| 2018 | $1,549 +10.7% | $15,750 +18.2% |
| 2017 | $1,399 +10.3% | $13,330 +2.3% |
| 2016 | $1,269 -1.3% | $13,030 +5.7% |
| 2015 | $1,285 | $12,330 +32.3% |
| 2014 | -- | $9,320 +24.8% |
| 2013 | -- | $7,470 -11.2% |
| 2012 | -- | $8,410 -4% |
| 2011 | -- | $8,760 -27.7% |
| 2010 | -- | $12,110 -42.7% |
| 2009 | -- | $21,130 -16.2% |
| 2008 | -- | $25,200 +26.6% |
| 2007 | -- | $19,900 +677.3% |
| 2006 | -- | $2,560 +39.1% |
| 2005 | -- | $1,840 |
| 2004 | -- | $1,840 |
Find assessor info on the county website
Monthly payment
Climate risks
Neighborhood: Maryvale
Nearby schools
Schools provided by the listing agent
- Elementary: Sheely Farms Elementary School
- Middle: Sheely Farms Elementary School
- High: Tolleson Union High School
- District: Tolleson Union High School District (214)
Source: The MLS. This data may not be complete. We recommend contacting the local school district to confirm school assignments for this home.


Similar homes
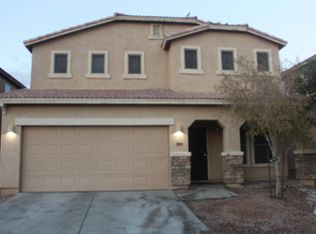
- $--3 bd2 ba1.3k sqft8537 W Virginia Ave, Phoenix, AZ 85037AuctionAuction.com 2
- $374,9003 bd2 ba1.5k sqft9124 W BERKELEY Road, Phoenix, AZ 85037For Sale
 MLS ID #7069638, Rodney Faria, West USA Realty. ARMLS
- $420,0004 bd2 ba1.9k sqft9110 W VERNON Avenue, Phoenix, AZ 85037For Sale
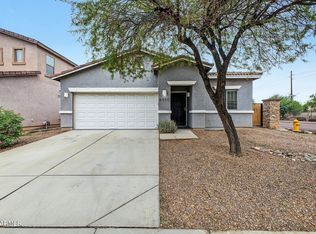 MLS ID #7093608, Jennifer Chaidez, Revinre. ARMLS
- $420,0003 bd3 ba2.1k sqft9131 W HUBBELL Street, Phoenix, AZ 85037For Sale
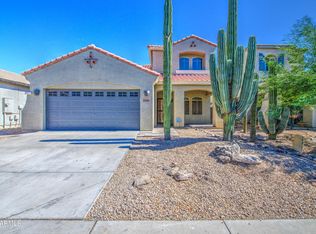 MLS ID #7053254, Ancie Mendez, Six Zero Two Real Estate Group LLC. ARMLS
