This 1092 square foot single family home has 3 bedrooms and 1.0 bathrooms. This home is located at 914 Walnut Dr, Oxnard, CA 93036.
Pre-foreclosure
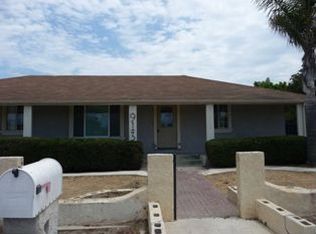
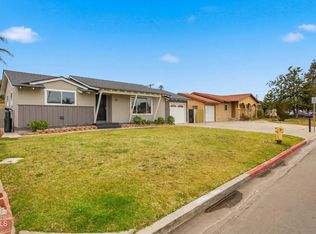
Street View
Est. $722,900
914 Walnut Dr, Oxnard, CA 93036
3beds
1baths
1,092sqft
SingleFamily
Built in 1951
0.3 Acres Lot
$722,900 Zestimate®
$662/sqft
$-- HOA
Overview
- 367 days |
- 29 |
- 3 |
Facts & features
Interior
Bedrooms & bathrooms
- Bedrooms: 3
- Bathrooms: 1
Interior area
- Total interior livable area: 1,092 sqft
Property
Parking
- Parking features: Garage - Attached
Lot
- Size: 0.3 Acres
Details
- Parcel number: 1450092010
Construction
Type & style
- Home type: SingleFamily
Condition
- Year built: 1951
Community & HOA
Location
- Region: Oxnard
Financial & listing details
- Price per square foot: $662/sqft
- Tax assessed value: $531,032
- Annual tax amount: $6,947
Visit our professional directory to find a foreclosure specialist in your area that can help with your home search.
Find a foreclosure agentForeclosure details
Estimated market value
$722,900
$672,000 - $766,000
$3,419/mo
Price history
| Date | Event | Price |
|---|---|---|
| 10/10/2003 | Sold | $355,000+25.9%$325/sqft |
Source: Public Record Report a problem | ||
| 7/22/2003 | Sold | $282,000$258/sqft |
Source: Public Record Report a problem | ||
Public tax history
| Year | Property taxes | Tax assessment |
|---|---|---|
| 2025 | $6,947 +2.8% | $531,032 +2% |
| 2024 | $6,758 | $520,620 +2% |
| 2023 | $6,758 +3.3% | $510,412 +2% |
| 2022 | $6,543 +5.5% | $500,404 +7.3% |
| 2021 | $6,204 +1.2% | $466,286 +1% |
| 2020 | $6,131 +9% | $461,506 +9.9% |
| 2019 | $5,623 +13.2% | $420,000 +14.4% |
| 2018 | $4,969 +6.3% | $367,000 +6.1% |
| 2017 | $4,674 +2.2% | $346,000 +2.1% |
| 2016 | $4,574 +1.1% | $339,000 +0.3% |
| 2015 | $4,526 +23.4% | $338,000 +27.5% |
| 2014 | $3,667 | $265,000 +3.1% |
| 2013 | -- | $257,000 +5.8% |
| 2012 | -- | $243,000 +10.5% |
| 2011 | -- | $220,000 -18.2% |
| 2009 | -- | $269,000 -28.6% |
| 2007 | -- | $376,728 +2% |
| 2006 | -- | $369,342 +2% |
| 2005 | -- | $362,100 +115.8% |
| 2003 | -- | $167,818 +2% |
| 2002 | -- | $164,528 +2% |
| 2001 | $1,713 +2.4% | $161,302 +2% |
| 2000 | $1,673 | $158,140 |
Find assessor info on the county website
Monthly payment
Estimated monthly payment$1,822
All calculations are estimates and provided by Zillow, Inc. for informational purposes only. Actual amounts may vary.
HOA fees may include property taxes on listings classified as Co-Ops. Contact the listing agent and/or owner for fee details.
Mortgage interest rates are dependent on a number of factors, including credit score, down payment, and repayment length. Interest rate data provided by Zillow Group Marketplace, Inc. as of 1/1/1970 from various mortgage lenders with which we have lead or other similar arrangements; the Estimated Payment is an average of those rates.
See how much you could borrow to make a competitive offer.
Climate risks
Neighborhood: El Rio
Nearby schools
GreatSchools rating
- 2/10Rio Plaza Elementary SchoolGrades: K-5Distance: 0.3 mi
- 4/10Rio Del Valle Middle SchoolGrades: 6-8Distance: 0.3 mi
- 5/10Rio Mesa High SchoolGrades: 9-12Distance: 1.5 mi


- California
- Ventura County
- Oxnard
- 93036
- El Rio
- 914 Walnut Dr
Nearby cities
Nearby neighborhoods
Nearby zip codes
Other Oxnard Topics
