Move right in! This beautiful 2 BR / 1 BA ranch in sought after Milwood neighborhood can be sold fully turn-key, including all furniture, decor, and household items for just an additional $6,000. Located near Western Michigan University and major hospitals, this single-level property is ideal for homebuyers, medical professionals, or real estate investors seeking a compliant, cash-flowing mid-term rental. With newer roof, siding, central A/C, water softener and more, this property provides the peace of mind you're looking for in your next home purchase. Schedule your private tour today!
Listing agent is related to seller.
Active
$194,000
920 Sunnock Ave, Kalamazoo, MI 49001
2beds
698sqft
Single Family Residence
Built in 1950
8,712 Square Feet Lot
$-- Zestimate®
$278/sqft
$-- HOA
What's special
Single-level propertyNewer roofWater softener
- 3 days
- 340
- 12
Zillow last checked:
Listing updated:
Listed by:
Brayden J Blauw 269-352-0029,
Bellabay Realty, LLC 269-459-1471
Source: MichRIC,MLS#: 26059036
Facts & features
Interior
Bedrooms & bathrooms
- Bedrooms: 2
- Bathrooms: 1
- Full bathrooms: 1
- Main level bedrooms: 2
Heating
- Forced Air
Cooling
- Central Air
Appliances
- Included: Dishwasher, Dryer, Oven, Range, Refrigerator, Washer
- Laundry: Main Level
Features
- Ceiling Fan(s)
- Basement: Slab
- Has fireplace: No
Interior area
- Total structure area: 698
- Total interior livable area: 698 sqft
Property
Parking
- Total spaces: 1
- Parking features: Garage Door Opener, Attached
- Garage spaces: 1
Features
- Stories: 1
- Fencing: Privacy
Lot
- Size: 8,712 Square Feet
- Dimensions: 66.58 by 131.5
Details
- Parcel number: 0635115001
Construction
Type & style
- Home type: SingleFamily
- Architectural style: Ranch
- Property subtype: Single Family Residence
Materials
- Vinyl Siding
Condition
- New construction: No
- Year built: 1950
Utilities & green energy
- Sewer: Public Sewer
- Water: Public
Community & HOA
Location
- Region: Kalamazoo
Financial & listing details
- Price per square foot: $278/sqft
- Tax assessed value: $50,100
- Annual tax amount: $3,262
- Date on market: 11/6/2026
- Listing terms: Cash,FHA,VA Loan,Conventional
Estimated market value
Not available
Estimated sales range
Not available
$1,459/mo
Price history
| Date | Event | Price |
|---|---|---|
| 11/6/2026 | Listed for sale | $194,000-3%$278/sqft |
Source:  MichRIC #26059036 Report a problem | ||
| 7/27/2026 | Listing removed | -- |
Source: Owner Report a problem | ||
| 6/12/2026 | Listed for sale | $199,900+80.1%$286/sqft |
Source: Owner Report a problem | ||
| 8/18/2025 | Sold | $111,000+593.8%$159/sqft |
Source: Public Record Report a problem | ||
| 5/15/2025 | Listing removed | $2,300$3/sqft |
Source: Zillow Rentals Report a problem | ||
| 1/3/2025 | Listed for rent | $2,300$3/sqft |
Source: Zillow Rentals Report a problem | ||
| 11/14/2023 | Listing removed | -- |
Source: Zillow Rentals Report a problem | ||
| 10/26/2023 | Price change | $2,300+9.5%$3/sqft |
Source: Zillow Rentals Report a problem | ||
| 10/24/2023 | Listed for rent | $2,100+121.1%$3/sqft |
Source: Zillow Rentals Report a problem | ||
| 3/12/2021 | Listing removed | -- |
Source: Berkshire Hathaway HomeServices Michigan and Northern Indiana Real Estate Report a problem | ||
| 2/24/2021 | Listed for rent | $950+5.6%$1/sqft |
Source: Berkshire Hathaway HomeServices Michigan and Northern Indiana Real Estate #21005379 Report a problem | ||
| 3/25/2019 | Listing removed | $900$1/sqft |
Source: Berkshire Hathaway HomeServices Michigan Real Esta Report a problem | ||
| 3/19/2019 | Listed for rent | $900$1/sqft |
Source: Berkshire Hathaway HomeServices Michigan Real Esta Report a problem | ||
| 2/27/2013 | Sold | $16,000-32.5%$23/sqft |
Source: MichRIC #12061666 Report a problem | ||
| 7/27/2012 | Sold | $23,691$34/sqft |
Source: Public Record Report a problem | ||
Public tax history
| Year | Property taxes | Tax assessment |
|---|---|---|
| 2026 | $3,263 +1.4% | $50,100 +6.1% |
| 2025 | $3,218 +68.4% | $47,200 +1.5% |
| 2024 | $1,911 | $46,500 +8.9% |
| 2023 | -- | $42,700 +11.5% |
| 2022 | -- | $38,300 +6.7% |
| 2021 | -- | $35,900 +3.2% |
| 2020 | -- | $34,800 +38.1% |
| 2018 | -- | $25,200 +4.6% |
| 2017 | $1,184 | $24,100 +5.2% |
| 2016 | $1,184 | $22,900 |
| 2015 | $1,184 | $22,900 +3.2% |
| 2014 | $1,184 | $22,200 +2.8% |
| 2013 | -- | $21,600 -0.5% |
| 2012 | -- | $21,700 -19.3% |
| 2011 | -- | $26,900 -9.7% |
| 2010 | -- | $29,800 -16.8% |
| 2009 | -- | $35,800 -7% |
| 2008 | -- | $38,500 +39% |
| 2004 | -- | $27,700 +0.5% |
| 2003 | -- | $27,550 -0.5% |
| 2002 | -- | $27,700 +11.9% |
| 2001 | -- | $24,750 |
Find assessor info on the county website
Monthly payment
Est. payment
Payment breakdown
Explore the cost of this home by adjusting the details. Changes won't be saved.Climate risks
Neighborhood: Milwood


Similar homes
- $170,0002 bd2 ba1k sqft1612 Buena Vista St, Kalamazoo, MI 49001For Sale

 MLS ID #26053526, Veronica R Tultz, Berkshire Hathaway HomeServices MI. MichRIC
- $195,0002 bd1 ba888 sqft5069 N Westnedge Ave, Kalamazoo, MI 49004For Sale
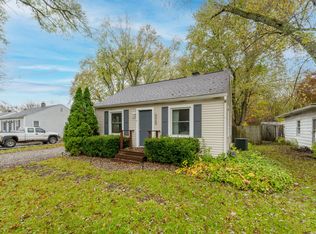 MLS ID #26059083, Dennis Bronson, Chuck Jaqua, REALTOR. MichRIC
- $159,9004 bd1 ba978 sqft1340 E Vine St, Kalamazoo, MI 49001For Sale
 MLS ID #26058564, Charles Teunis, Bellabay Realty LLC. MichRIC
- $189,9002 bd1 ba832 sqft521 Hutchinson St, Kalamazoo, MI 49008For Sale
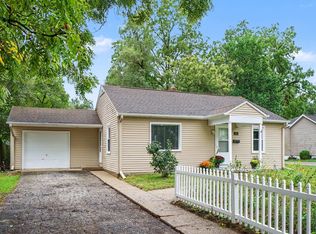 MLS ID #26049411, Victoria Ziemer, Five Star Real Estate. MichRIC
- $200,0003 bd1 ba875 sqft2436 Monterey Dr, Kalamazoo, MI 49004For SaleMLS ID #26057560, Nancy E Streich, Berkshire Hathaway HomeServices MI. MichRIC
- $189,9003 bd1 ba1k sqft132 Gilkison Ave, Kalamazoo, MI 49006For SaleMLS ID #26058669, Mary C Norris, Chuck Jaqua, REALTOR. MichRIC
- $230,0003 bd1 ba960 sqft2816 S Park St, Kalamazoo, MI 49001For SaleMLS ID #26057949, Carle Watts, Lifestyles Real Estate and Staging LLC. MichRIC
- $142,0003 bd1 ba999 sqft49 Blanche Ave, Kalamazoo, MI 49001For SaleMLS ID #26058542, Tammy L Waller, Location Realty. MichRIC
- $174,0003 bd1 ba944 sqft4026 Rivington St, Kalamazoo, MI 49008For SaleMLS ID #26056255, Charity B Sodano, Berkshire Hathaway HomeServices MI. MichRIC
- $199,9003 bd1 ba1k sqft3112 Courtlandt Ave, Kalamazoo, MI 49004For SaleMLS ID #26055785, Nicholas Dennison, Fervor Realty. MichRIC
- $199,0002 bd1 ba675 sqft3621 Adams St, Kalamazoo, MI 49008For SaleMLS ID #26049442, Lija Austrins, Gardner Realty, LLC. MichRIC
- $145,0002 bd1 ba886 sqft425 Garland St, Kalamazoo, MI 49001For SaleMLS ID #26037595, Greg S Miller, Berkshire Hathaway HomeServices MI. MichRIC
- $163,5002 bd1 ba720 sqft2330 Hillsdale Ave, Kalamazoo, MI 49006For SaleMLS ID #26046994, Jessica L Vliek, Evenboer Walton, REALTORS. MichRIC
- $169,9003 bd1 ba982 sqft3620 Madison St, Kalamazoo, MI 49008For SaleMLS ID #26053417, Sarah Henry, Kalvan Realty, Inc.. MichRIC
- $180,0002 bd1 ba930 sqft5441 Collingwood Ave, Kalamazoo, MI 49004For SaleMLS ID #26052899, Leah L Dekema, Strong Properties, LLC. MichRIC
- $179,9002 bd1 ba885 sqft3636 Adams St, Kalamazoo, MI 49008For SaleMLS ID #26042404, Natalie J Rowe, RE/MAX Advantage. MichRIC
- $219,9002 bd2 ba1k sqft5171 N 20th St, Kalamazoo, MI 49004For SaleMLS ID #26054733, Chris C Jenkins, Five Star Real Estate. MichRIC
- $154,9002 bd2 ba894 sqft3407 Kenbrooke Ct, Kalamazoo, MI 49006For SaleMLS ID #26058784, Jeremy A Blair, eXp Realty LLC. MichRIC
