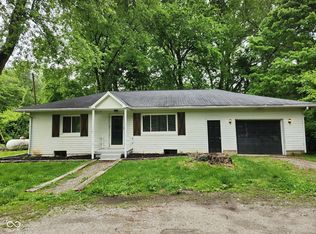
Great location on west side of Noblesville
This property is off market, which means it's not currently listed for sale or rent on Zillow. This may be different from what's available on other websites or public sources.
$200,700
$173,000 - $231,000
$1,524/mo
$1,524/mo
Rent Zestimate®
Find your next renter with Zillow Rental Manager. Plus, with online applications, you can quickly screen prospective tenants – for free.
$1,524/mo
Rent Zestimate®
$1,267/mo
Est. payment
Refinancing to a lower rate could help reduce your monthly payments and save thousands over the life of the loan.
$1,267/mo
Est. payment
Work with a Zillow partner agent
Leverage their expertise and Zillow's premium Showcase listings to get your home seen by more buyers.
Get startedList with your own agent
Get your home in front of millions of buyers by listing it on Zillow.
Learn how to do itSell it yourself
Take full control of how buyers see your home on Zillow by listing For Sale by Owner (FSBO).
List your homeGreat location on west side of Noblesville
This property is off market, which means it's not currently listed for sale or rent on Zillow. This may be different from what's available on other websites or public sources.
| Date | Event | Price |
|---|---|---|
| 9/9/2022 | Sold | $107,000+1%$97/sqft |
Source: | ||
| 8/28/2022 | Pending sale | $105,894$96/sqft |
Source: | ||
| 8/25/2022 | Listed for sale | $105,894-18.5%$96/sqft |
Source: | ||
| 3/15/2022 | Listing removed | -- |
Source: | ||
| 3/9/2022 | Listed for sale | $130,000$118/sqft |
Source: | ||
| 2/15/2022 | Pending sale | $130,000$118/sqft |
Source: | ||
| 2/10/2022 | Listed for sale | $130,000+30.1%$118/sqft |
Source: | ||
| 9/10/2021 | Sold | $99,900$91/sqft |
Source: | ||
| 5/8/2021 | Listed for sale | $99,900-9.1%$91/sqft |
Source: Owner Report a problem | ||
| 4/5/2017 | Listing removed | $109,900$100/sqft |
Source: Armstrong Real Estate Brokerag #21447538 Report a problem | ||
| 10/8/2016 | Listed for sale | $109,900-4.4%$100/sqft |
Source: Armstrong Real Estate Brokerag #21447538 Report a problem | ||
| 5/3/2015 | Listing removed | $115,000$104/sqft |
Source: Kohler Realty #21290424 Report a problem | ||
| 4/13/2015 | Listed for sale | $115,000-1.7%$104/sqft |
Source: Metropolitan Indianapolis Board of REALTORS #21290424 Report a problem | ||
| 5/7/2014 | Listing removed | $117,000$106/sqft |
Source: F.C. Tucker Company, Inc. #21221736 Report a problem | ||
| 3/21/2013 | Listed for sale | $117,000-6.4%$106/sqft |
Source: F.C. Tucker Company, Inc. #21221736 Report a problem | ||
| 8/7/2012 | Listing removed | $125,000$113/sqft |
Source: F.C. Tucker Company, Inc. #21159837 Report a problem | ||
| 2/8/2012 | Listed for sale | $125,000$113/sqft |
Source: F. C. Tucker Company, Inc #21159837 Report a problem | ||
| Year | Property taxes | Tax assessment |
|---|---|---|
| 2025 | $2,211 -1.1% | $148,200 +63.6% |
| 2024 | $2,234 +3.2% | $90,600 |
| 2023 | $2,165 +4.5% | $90,600 +5.3% |
| 2022 | $2,072 -2.6% | $86,000 +4.4% |
| 2021 | $2,128 +4.5% | $82,400 +0.1% |
| 2020 | $2,035 -27.2% | $82,300 -28.2% |
| 2019 | $2,795 +5.4% | $114,700 +3.8% |
| 2018 | $2,652 +1.1% | $110,500 +1.1% |
| 2017 | $2,622 +4.3% | $109,300 |
| 2016 | $2,515 +0.6% | $109,300 +5.3% |
| 2014 | $2,501 -9.8% | $103,800 -10.9% |
| 2013 | $2,774 +0.5% | $116,500 +1% |
| 2012 | $2,760 +18.9% | $115,400 +15.1% |
| 2011 | $2,321 +1.1% | $100,300 |
| 2010 | $2,297 +12.8% | $100,300 |
| 2009 | $2,035 +6% | $100,300 +12.3% |
| 2007 | $1,920 +6.5% | $89,300 |
| 2006 | $1,804 | $89,300 +3.5% |
| 2005 | -- | $86,300 +115.8% |
| 2002 | $1,222 -18.4% | $40,000 +134.5% |
| 2001 | $1,498 | $17,060 |
Find assessor info on the county website
Source: The MLS. This data may not be complete. We recommend contacting the local school district to confirm school assignments for this home.