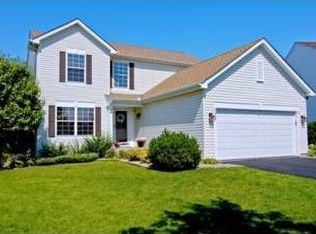
Perfect
This property is off market, which means it's not currently listed for sale or rent on Zillow. This may be different from what's available on other websites or public sources.
$518,500
$493,000 - $544,000
$3,156/mo
$3,156/mo
Rent Zestimate®
Find your next renter with Zillow Rental Manager. Plus, with online applications, you can quickly screen prospective tenants – for free.
$3,156/mo
Rent Zestimate®
$2,798/mo
Est. payment
Refinancing to a lower rate could help reduce your monthly payments and save thousands over the life of the loan.
$2,798/mo
Est. payment
Work with a Zillow partner agent
Leverage their expertise and Zillow's premium Showcase listings to get your home seen by more buyers.
Get startedList with your own agent
Get your home in front of millions of buyers by listing it on Zillow.
Learn how to do itSell it yourself
Take full control of how buyers see your home on Zillow by listing For Sale by Owner (FSBO).
List your homePerfect
This property is off market, which means it's not currently listed for sale or rent on Zillow. This may be different from what's available on other websites or public sources.
| Date | Event | Price |
|---|---|---|
| 5/1/2019 | Sold | $378,900-0.3%$137/sqft |
Source: | ||
| 3/25/2019 | Pending sale | $379,900$138/sqft |
Source: RE/MAX Results #5143299 Report a problem | ||
| 2/20/2019 | Price change | $379,900-2.3%$138/sqft |
Source: RE/MAX Results #5143299 Report a problem | ||
| 2/8/2019 | Listed for sale | $389,000+1.1%$141/sqft |
Source: RE/MAX Results #5143299 Report a problem | ||
| 3/31/2017 | Sold | $384,900$140/sqft |
Source: | ||
| 2/21/2017 | Pending sale | $384,900$140/sqft |
Source: Coldwell Banker Burnet - Eden Prairie #4795950 Report a problem | ||
| 2/17/2017 | Listed for sale | $384,900+7.2%$140/sqft |
Source: Coldwell Banker Burnet #4795950 Report a problem | ||
| 12/29/2014 | Listing removed | $359,000$130/sqft |
Source: Edina Realty, Inc., a Berkshire Hathaway affiliate #4536450 Report a problem | ||
| 11/13/2014 | Price change | $359,000-2.7%$130/sqft |
Source: Edina Realty, Inc., a Berkshire Hathaway affiliate #4536450 Report a problem | ||
| 10/13/2014 | Listed for sale | $369,000+5.4%$134/sqft |
Source: Edina Realty, Inc., a Berkshire Hathaway affiliate #4536450 Report a problem | ||
| 8/29/2011 | Listing removed | $350,000$127/sqft |
Source: Remax Action West #4024744 Report a problem | ||
| 5/12/2011 | Price change | $350,000-2.5%$127/sqft |
Source: RE/MAX Action West, Inc. #4024744 Report a problem | ||
| 4/13/2011 | Price change | $359,000-1.1%$130/sqft |
Source: RE/MAX ACTION WEST #4024744 Report a problem | ||
| 3/19/2011 | Listed for sale | $363,000-1.4%$132/sqft |
Source: RealEstateHomepages.com #4024744 Report a problem | ||
| 11/6/2010 | Listing removed | $368,000$133/sqft |
Source: Keller Williams - Maple Grove #3970478 Report a problem | ||
| 10/3/2010 | Price change | $368,000-1.6%$133/sqft |
Source: Northwest Partners, LLLP #3970478 Report a problem | ||
| 9/16/2010 | Price change | $373,9000%$136/sqft |
Source: Keller Williams - Maple Grove #3970478 Report a problem | ||
| 9/2/2010 | Price change | $374,000-0.2%$136/sqft |
Source: NRT Minneapolis #3958440 Report a problem | ||
| 8/11/2010 | Listed for sale | $374,888+101.7%$136/sqft |
Source: NRT Minneapolis #3958440 Report a problem | ||
| 8/3/1998 | Sold | $185,895$67/sqft |
Source: Public Record Report a problem | ||
| Year | Property taxes | Tax assessment |
|---|---|---|
| 2025 | $6,916 +5.4% | $459,300 -0.1% |
| 2024 | $6,562 +16.5% | $459,800 +2.5% |
| 2023 | $5,631 +15.2% | $448,800 +2.8% |
| 2022 | $4,890 +8.1% | $436,500 +22.8% |
| 2021 | $4,525 +5.7% | $355,400 +5.1% |
| 2020 | $4,283 -5.4% | $338,200 +0.9% |
| 2019 | $4,525 +5.7% | $335,200 +1.7% |
| 2018 | $4,283 +1% | $329,700 +10% |
| 2017 | $4,239 -0.7% | $299,700 +6% |
| 2016 | $4,267 +5.2% | $282,700 -3.1% |
| 2015 | $4,057 -6.1% | $291,800 +8.7% |
| 2014 | $4,321 +5.1% | $268,500 -1.6% |
| 2013 | $4,112 +0.2% | $273,000 -5.1% |
| 2012 | $4,103 +4.2% | $287,600 -1.2% |
| 2011 | $3,939 +3.2% | $291,000 -4.6% |
| 2010 | $3,816 -0.4% | $305,100 -5.2% |
| 2009 | $3,833 +5.5% | $322,000 +3.4% |
| 2006 | $3,634 +5.9% | $311,300 +9.8% |
| 2005 | $3,432 +4.2% | $283,400 +8.6% |
| 2004 | $3,295 -4.7% | $261,000 +11.8% |
| 2002 | $3,456 -50.1% | $233,500 |
| 2001 | $6,924 | -- |
Find assessor info on the county website
Source: The MLS. This data may not be complete. We recommend contacting the local school district to confirm school assignments for this home.