Great investment property in Robinson Heights at Waipahu! Multi-family with two beautiful houses on a 10,404 Sq. Ft. lot. 5 bedrooms, 3 bath downstairs as a possible foster home. Upstairs with separate entrance has two bedrooms, one bath and a spacious living and family room. Back house has 3 bedrooms, 2 bath with a separate electric meter. A total of 9 bedrooms and 6 full baths, this home prides itself with eight parkings on the property and includes 40 owned solar panels. Sold in As-Is Condition.
Active
$1,499,000
94-372 Haaa St, Waipahu, HI 96797
--beds
0baths
3,610sqft
Multi Family
Built in 1967
-- sqft lot
$1,462,300 Zestimate®
$415/sqft
$-- HOA
What's special
- 75 days
- 150
- 8
Likely to sell faster than
Zillow last checked:
Listing updated:
Listed by:
Mike Tavepholjalern 808-388-5411,
Fogarty Realty, Inc.
Source: HiCentral MLS,MLS#: 202615141
Facts & features
Interior
Bedrooms & bathrooms
- Bathrooms: 0
Interior area
- Total structure area: 3,610
- Total interior livable area: 3,610 sqft
Property
Parking
- Total spaces: 8
- Parking features: Assigned, Covered, Open
- Has uncovered spaces: Yes
Features
- Levels: Two
- Stories: 2
- Has view: Yes
- View description: City
- Frontage type: Other
Lot
- Features: Cleared, Dead End, Level
- Topography: Level
Details
- Parcel number: 1940320410000
- Zoning description: 05 - R-5 Residential District
- Special conditions: None
Construction
Type & style
- Home type: MultiFamily
- Property subtype: Multi Family
Materials
- Wood Frame
Condition
- Good Condition
- Year built: 1967
- Major remodel year: 1976
Utilities & green energy
- Sewer: Connected
- Water: Public
- Utilities for property: Cable Available, High Speed Internet Available, Phone Available, Sewer Available, Water Available, Sewer Connected
Community & HOA
Community
- Features: None
- Subdivision: Robinson Heights
Location
- Region: Waipahu
Financial & listing details
- Price per square foot: $415/sqft
- Tax assessed value: $1,353,400
- Annual tax amount: $8,400
- Date on market: 8/6/2026
- Total actual rent: 10000
Estimated market value
$1,462,300
$1.39M - $1.54M
$3,238/mo
Price history
| Date | Event | Price |
|---|---|---|
| 8/6/2026 | Listed for sale | $1,499,000$415/sqft |
Source:  HiCentral MLS #202615141 Report a problem | ||
| 4/22/2026 | Listing removed | $3,000$1/sqft |
Source: Zillow Rentals Report a problem | ||
| 2/19/2026 | Price change | $3,000-6.3%$1/sqft |
Source: Zillow Rentals Report a problem | ||
| 1/29/2026 | Listed for rent | $3,200+45.5%$1/sqft |
Source: Zillow Rentals Report a problem | ||
| 2/18/2024 | Listing removed | -- |
Source: Zillow Rentals Report a problem | ||
| 1/14/2024 | Price change | $2,200-31.3%$1/sqft |
Source: Zillow Rentals Report a problem | ||
| 12/31/2023 | Listed for rent | $3,200+45.5%$1/sqft |
Source: Zillow Rentals Report a problem | ||
| 11/2/2023 | Listing removed | -- |
Source: Zillow Rentals Report a problem | ||
| 10/12/2023 | Listed for rent | $2,200-8.3%$1/sqft |
Source: Zillow Rentals Report a problem | ||
| 9/29/2023 | Listing removed | -- |
Source: Zillow Rentals Report a problem | ||
| 9/14/2023 | Listed for rent | $2,400$1/sqft |
Source: Zillow Rentals Report a problem | ||
| 8/19/2023 | Listing removed | -- |
Source: Zillow Rentals Report a problem | ||
| 6/17/2023 | Price change | $2,400-20%$1/sqft |
Source: Zillow Rentals Report a problem | ||
| 6/1/2023 | Listed for rent | $3,000$1/sqft |
Source: Zillow Rentals Report a problem | ||
| 6/1/2023 | Listing removed | $1,499,000$415/sqft |
Source: HiCentral MLS #202310463 Report a problem | ||
| 5/25/2023 | Listing removed | -- |
Source: Zillow Rentals Report a problem | ||
| 5/9/2023 | Listed for sale | $1,499,000+11%$415/sqft |
Source: HiCentral MLS #202310456 Report a problem | ||
| 5/2/2023 | Price change | $3,000-40%$1/sqft |
Source: Zillow Rentals Report a problem | ||
| 4/14/2023 | Listed for rent | $5,000+56.3%$1/sqft |
Source: Zillow Rentals Report a problem | ||
| 4/14/2023 | Listing removed | $1,350,000$374/sqft |
Source: HiCentral MLS #202302617 Report a problem | ||
| 3/11/2023 | Price change | $1,350,000-3.5%$374/sqft |
Source: HiCentral MLS #202302617 Report a problem | ||
| 3/7/2023 | Listing removed | -- |
Source: Zillow Rentals Report a problem | ||
| 2/15/2023 | Listed for sale | $1,399,000$388/sqft |
Source: HiCentral MLS #202302617 Report a problem | ||
| 2/14/2023 | Listed for rent | $3,200$1/sqft |
Source: Zillow Rentals Report a problem | ||
| 11/6/2021 | Listing removed | -- |
Source: Zillow Rental Manager Report a problem | ||
Public tax history
| Year | Property taxes | Tax assessment |
|---|---|---|
| 2026 | $8,029 +14.3% | $1,353,400 +6.9% |
| 2025 | $7,027 -16.3% | $1,265,500 -8.7% |
| 2024 | $8,394 +12.4% | $1,385,400 +6.3% |
| 2023 | $7,464 +14.4% | $1,303,900 +9.3% |
| 2022 | $6,527 +103.9% | $1,193,000 +13.1% |
| 2021 | $3,201 +10.1% | $1,054,700 +8.7% |
| 2020 | $2,907 +0.6% | $970,500 +2.6% |
| 2019 | $2,889 +8% | $945,500 +6.9% |
| 2018 | $2,676 -2.4% | $884,500 -2.1% |
| 2017 | $2,743 +0.4% | $903,600 +0.4% |
| 2016 | $2,731 +17.5% | $900,200 +14.8% |
| 2015 | $2,324 | $784,000 +10.9% |
| 2014 | -- | $707,000 +1.6% |
| 2012 | -- | $696,000 +2% |
| 2011 | -- | $682,300 -5.7% |
| 2010 | -- | $723,800 -21.2% |
| 2009 | -- | $918,300 +0.7% |
| 2008 | -- | $912,200 +6.3% |
| 2007 | -- | $858,200 +19.7% |
| 2006 | -- | $716,800 +25.9% |
| 2005 | -- | $569,500 +22.6% |
| 2004 | -- | $464,500 +11.3% |
| 2003 | $1,179 +77.1% | $417,500 +29.3% |
| 2002 | $665 | $322,900 +7.3% |
| 1999 | -- | $301,000 |
Find assessor info on the county website
Monthly payment
Est. payment
Payment breakdown
Explore the cost of this home by adjusting the details. Changes won't be saved.Climate risks
Neighborhood: 96797


Similar homes
- $1,690,000-- bd-- ba3.6k sqft94-322 Pupuole St, Waipahu, HI 96797Active
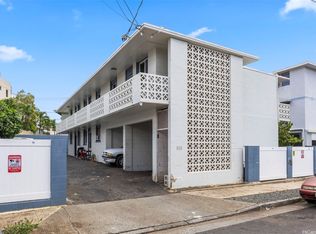
 MLS ID #202616287, Jennifer Vinson, NEXTHOME Hale Realty. HiCentral MLS
- $1,200,0004 bd3 ba2.2k sqft94-1104 Pulelo St, Waipahu, HI 96797Active
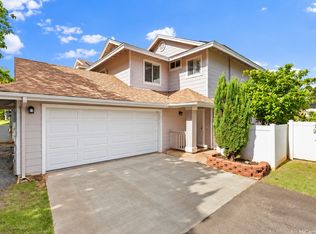 MLS ID #202619399, Colette E Nishimura, Coldwell Banker Realty. HiCentral MLS
- $1,210,0004 bd4 ba2.6k sqft94-653 Noheaiki Pl, Waipahu, HI 96797Active
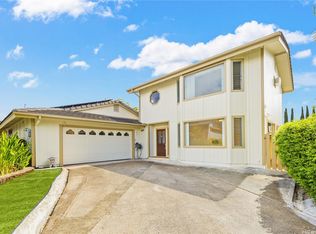 MLS ID #202616855, Michael S Moran, Michael Moran & Associates. HiCentral MLS
- $1,135,0003 bd3 ba2.2k sqft94-1018 Kalulu Loop, Waipahu, HI 96797Active
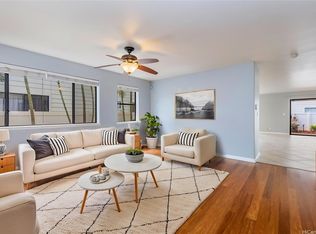 MLS ID #202616773, Shannon P Among, Redfin Corporation. HiCentral MLS
- $1,500,0003 bd3 ba2.6k sqft91-1033 Hoomaalili St, Ewa Beach, HI 96706ActiveMLS ID #202618282, Deep Shrestha, Keller Williams Honolulu. HiCentral MLS
- $1,150,0004 bd2 ba1.9k sqftHale Lumi, Waipahu, HI 96797ActiveMLS ID #202615819, Joey Mareko, Soldier To Soldier HI Realty. HiCentral MLS
- $1,464,0004 bd3 ba2.4k sqft92-152 Kohi Pl, Kapolei, HI 96707ActiveMLS ID #202617022, Vineeta Jetley, RE/MAX Honolulu. HiCentral MLS
- $1,399,0005 bd4 ba3.1k sqft92-1217 Uahanai St, Kapolei, HI 96707ActiveMLS ID #202614548, Matt Householder, Real Broker. HiCentral MLS
- $1,295,0004 bd3 ba1.9k sqft92-6031 Kohi St, Kapolei, HI 96707ActiveMLS ID #202617666, Bryan D Henson, Coldwell Banker Island Prop. HiCentral MLS
- $1,347,0004 bd2 ba2.1k sqft94-342 Aaahi St, Mililani, HI 96789ActiveMLS ID #202618890, Tricia Nekota, Dream Home Realty Hawaii LLC. HiCentral MLS
- $1,299,5005 bd3 ba2.1k sqft94-412 Kealohi Pl, Mililani, HI 96789ActiveMLS ID #202617036, Helen YN Bench, Bench Mark Realty. HiCentral MLS
- $1,550,0006 bd5 ba2.5k sqft95-152 Waimakua Dr, Mililani, HI 96789ActiveMLS ID #202615567, Adrienne W Lally, Team Lally. HiCentral MLS
- $1,450,0006 bd4 ba3k sqft51-015 Lau Pl, Kaaawa, HI 96730ActiveMLS ID #202611175, LaRona L Groff-Bennett, Equity Hawaii Real Estate, LLC. HiCentral MLS
- $1,450,0004 bd4 ba2.2k sqft2159A Awikiwiki Pl, Pearl City, HI 96782ActiveMLS ID #202614806, Cindy Siok, At Home Hawaii LLC. HiCentral MLS
- $1,275,0004 bd2 ba1.9k sqft94-372 Kahulialii St, Mililani, HI 96789ActiveMLS ID #202616697, Ally M Uyehara, Engel & Volkers Honolulu. HiCentral MLS
- $1,540,0004 bd3 ba2.5k sqft95-1022 Hololea St, Mililani, HI 96789ActiveMLS ID #202613842, Amanda McCann, Hawaii Modern Realty. HiCentral MLS
- $1,380,0004 bd3 ba2.2k sqft91-1061 Waikapuna St, Ewa Beach, HI 96706ActiveMLS ID #202618754, Doug R Alston, Island Sun Real Estate Pros. HiCentral MLS
- $1,675,0003 bd3 ba2.1k sqft92-1492 Makakilo Dr, Kapolei, HI 96707ActiveMLS ID #202613798, Kayo Puerto, Pacific Image Properties. HiCentral MLS
- $1,499,5004 bd2 ba2.1k sqft47-494 Apoalewa Pl, Kaneohe, HI 96744ActiveMLS ID #202617056, Artie Wilson, Artie Wilson & Associates. HiCentral MLS
