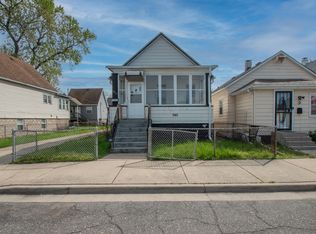
UNIQUE PROPERTY WITH 2 HOMES ON 1 LOT
Newly remodeled both homes, new siding, soffits, gutters, windows
New flooring throughout, bathrooms have new bathtubs, tile, flooring, etc.
Rear House in 1-bedroom 400 sq.ft. 1 bathroom
Front house is 4-bedroom 1600 sq.ft. 2 bathrooms
Rental income potential is HUGE!, live in one unit and rent the other
This is a must see!
For sale by owner
$319,999
946 Sibley St, Hammond, IN 46320
5beds
2,000sqft
MultiFamily
Built in 1910
-- sqft lot
$-- Zestimate®
$160/sqft
$-- HOA
What's special
Bathrooms have new bathtubsNew sidingNew flooring throughoutNewly remodeled both homes
- 99 days
- 524
- 24
Listed by:
Property Owner (219) 776-8475
Facts & features
Interior
Bedrooms & bathrooms
- Bedrooms: 5
- Bathrooms: 3
- Full bathrooms: 3
Heating
- Forced air, Gas
Cooling
- None
Appliances
- Included: Dishwasher, Garbage disposal, Microwave, Range / Oven, Refrigerator
Features
- Flooring: Carpet, Linoleum / Vinyl
- Basement: Finished
Interior area
- Total interior livable area: 2,000 sqft
Property
Parking
- Parking features: On-street
Features
- Exterior features: Vinyl
- Has view: Yes
- View description: City
Lot
- Size: 2,962 Square Feet
Details
- Parcel number: 450331377017000023
Construction
Type & style
- Home type: MultiFamily
Materials
- Frame
- Roof: Asphalt
Condition
- New construction: No
- Year built: 1910
Community & HOA
Location
- Region: Hammond
Financial & listing details
- Price per square foot: $160/sqft
- Tax assessed value: $134,700
- Annual tax amount: $2,672
- Date on market: 5/30/2026
Estimated market value
Not available
Estimated sales range
Not available
$1,432/mo
Price history
| Date | Event | Price |
|---|---|---|
| 7/9/2026 | Price change | $319,9990%$160/sqft |
Source: Owner Report a problem | ||
| 5/30/2026 | Listed for sale | $320,000$160/sqft |
Source: Owner Report a problem | ||
Public tax history
| Year | Property taxes | Tax assessment |
|---|---|---|
| 2025 | $2,672 -4.8% | $134,700 +11.4% |
| 2024 | $2,806 +5.1% | $120,900 +15.7% |
| 2023 | $2,669 +44% | $104,500 +4.9% |
| 2022 | $1,854 +8% | $99,600 +45.6% |
| 2021 | $1,717 +1.3% | $68,400 +8.7% |
| 2020 | $1,695 -12.5% | $62,900 +2.6% |
| 2019 | $1,938 -12.4% | $61,300 |
| 2018 | $2,213 +47.8% | $61,300 +0.2% |
| 2017 | $1,497 | $61,200 +14.2% |
| 2016 | $1,497 -7.6% | $53,600 +3.7% |
| 2014 | $1,620 +1.2% | $51,700 -4.3% |
| 2013 | $1,601 -5.4% | $54,000 +0.4% |
| 2012 | $1,693 +83% | $53,800 +76.4% |
| 2011 | $925 -8.9% | $30,500 |
| 2010 | $1,015 | $30,500 -35.2% |
| 2009 | -- | $47,100 +4.9% |
| 2007 | -- | $44,900 +7.2% |
| 2006 | -- | $41,900 |
| 2005 | -- | $41,900 |
Find assessor info on the county website
Monthly payment
Est. payment