Three bedrooms, one and a half baths, spread across multiple levels. Located in Bowers Heights, featuring solar panels for energy efficiency. Roof is approximately 7 years old.Features a large backyard and an attached garage with additional off street parking.
For sale
$260,000
953 Marla Ave, Logan, OH 43138
3beds
1,384sqft
Single Family Residence
Built in 1973
8,276 Square Feet Lot
$-- Zestimate®
$188/sqft
$-- HOA
What's special
- 2 days
- 176
- 2
Zillow last checked:
Listing updated:
Listed by:
Danielle Wolfe 614-679-8034,
Key Realty
Source: Columbus and Central Ohio Regional MLS ,MLS#: 226041928
Facts & features
Interior
Bedrooms & bathrooms
- Bedrooms: 3
- Bathrooms: 2
- Full bathrooms: 1
- 1/2 bathrooms: 1
Heating
- Baseboard
Cooling
- Central Air
Appliances
- Included: Dishwasher, Electric Range, Electric Water Heater, Microwave
- Laundry: Electric Dryer Hookup
Features
- Flooring: Laminate, Carpet, Vinyl
- Windows: Insulated Windows
- Basement: Partial
- Has fireplace: No
- Common walls with other units/homes: No Common Walls
Interior area
- Total structure area: 1,384
- Total interior livable area: 1,384 sqft
Property
Parking
- Total spaces: 1
- Parking features: Attached
- Garage spaces: 1
Features
- Levels: Multi/Split
- Patio & porch: Porch
Lot
- Size: 8,276 Square Feet
Details
- Parcel number: 04002593.0000
Construction
Type & style
- Home type: SingleFamily
- Property subtype: Single Family Residence
Materials
- Foundation: Block
Condition
- New construction: No
- Year built: 1973
Utilities & green energy
- Sewer: Public Sewer
- Water: Public
Community & HOA
Community
- Subdivision: Bowers Heights
HOA
- Has HOA: No
Location
- Region: Logan
Financial & listing details
- Price per square foot: $188/sqft
- Tax assessed value: $192,690
- Annual tax amount: $2,014
- Date on market: 11/4/2026
- Listing terms: VA Loan,FHA,Conventional
Estimated market value
Not available
Estimated sales range
Not available
Not available
Price history
| Date | Event | Price |
|---|---|---|
| 11/4/2026 | Listed for sale | $260,000-3.7%$188/sqft |
Source:  Columbus and Central Ohio Regional MLS #226041928 Report a problem | ||
| 10/9/2026 | Listing removed | $269,900$195/sqft |
Source: Columbus and Central Ohio Regional MLS #226010920 Report a problem | ||
| 8/3/2026 | Price change | $269,900-1.9%$195/sqft |
Source: Columbus and Central Ohio Regional MLS #226010920 Report a problem | ||
| 6/11/2026 | Price change | $275,000-3.5%$199/sqft |
Source: Columbus and Central Ohio Regional MLS #226010920 Report a problem | ||
| 4/22/2026 | Price change | $285,000-3.4%$206/sqft |
Source: Columbus and Central Ohio Regional MLS #226010920 Report a problem | ||
| 4/8/2026 | Listed for sale | $295,000+3.5%$213/sqft |
Source: Columbus and Central Ohio Regional MLS #226010920 Report a problem | ||
| 11/28/2025 | Listing removed | $285,000$206/sqft |
Source: Columbus and Central Ohio Regional MLS #225032439 Report a problem | ||
| 10/29/2025 | Price change | $285,000-1.4%$206/sqft |
Source: Columbus and Central Ohio Regional MLS #225032439 Report a problem | ||
| 9/15/2025 | Price change | $289,000-3.6%$209/sqft |
Source: Columbus and Central Ohio Regional MLS #225032439 Report a problem | ||
| 9/3/2025 | Listed for sale | $299,900$217/sqft |
Source: Columbus and Central Ohio Regional MLS #225032439 Report a problem | ||
Public tax history
| Year | Property taxes | Tax assessment |
|---|---|---|
| 2025 | $3,861 +30.8% | $67,440 +35.9% |
| 2024 | $2,952 | $49,620 |
| 2023 | $2,952 | $49,620 |
| 2022 | $2,952 +32% | $49,620 +33.2% |
| 2021 | $2,237 | $37,250 |
| 2020 | $2,237 +84.5% | $37,250 |
| 2019 | $1,213 +15.9% | $37,250 +10.3% |
| 2018 | $1,046 +6.2% | $33,780 |
| 2017 | $985 +0.7% | $33,780 |
| 2016 | $978 +3.8% | $33,780 +5.5% |
| 2015 | $943 -0.2% | $32,030 |
| 2014 | $944 -0.4% | $32,030 |
| 2013 | $948 -0.5% | $32,030 -1.5% |
| 2012 | $953 +1.7% | $32,530 |
| 2011 | $936 -2.1% | $32,530 |
| 2010 | $956 | $32,530 |
Find assessor info on the county website
Monthly payment
Est. payment
Payment breakdown
Explore the cost of this home by adjusting the details. Changes won't be saved.Climate risks
Neighborhood: 43138
Similar homes
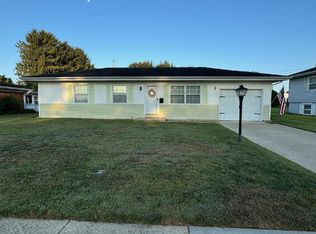
- $235,0003 bd2 ba1.2k sqft699 E 2nd St, Logan, OH 43138For Sale

 MLS ID #226041105, AMANDA MYERS, Rock House Realty LLC. Columbus and Central Ohio Regional MLS
- $284,0003 bd2 ba1.3k sqft293 Mae St, Logan, OH 43138For Sale
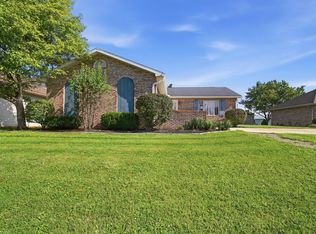 MLS ID #226033114, Bryan R Mulvany, Hart Real Estate Agency LLC. Columbus and Central Ohio Regional MLS
- $249,0003 bd1 ba1k sqft595 E Hunter St, Logan, OH 43138For Sale
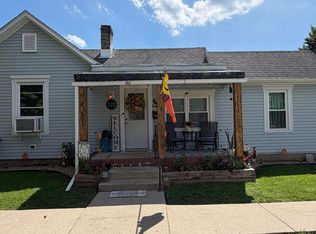 MLS ID #226033060, Sandra M Adair, Century 21 HomeStar. Columbus and Central Ohio Regional MLS
- $260,0003 bd2 ba1.3k sqft10287 State Route 664 N, Logan, OH 43138For Sale
 MLS ID #226031688, Nazira M Yusupova, Carleton Realty, LLC. Columbus and Central Ohio Regional MLS
- $265,0003 bd1 ba1.2k sqft33477 Till Rd, Logan, OH 43138For SaleMLS ID #226033676, Diane Janelle Green, Walker Tiu Real Estate Group. Columbus and Central Ohio Regional MLS
- $280,0003 bd2 ba1.4k sqft1005 Church St, Logan, OH 43138For SaleMLS ID #226040916, Stephanie Harget, Real of Ohio. Columbus and Central Ohio Regional MLS
- $225,0003 bd2 ba1.8k sqft270 N Walnut St, Logan, OH 43138For SaleMLS ID #226020183, Sandra M Adair, Century 21 HomeStar. Columbus and Central Ohio Regional MLS
- $279,9003 bd3 ba1.6k sqft1165 Church St, Logan, OH 43138For SaleMLS ID #226021908, AMANDA MYERS, Rock House Realty LLC. Columbus and Central Ohio Regional MLS
- $229,9004 bd3 ba2k sqft67 W Front St, Logan, OH 43138For SaleMLS ID #226029451, Alex R Enderle, Best Homes Real Estate Ltd.. Columbus and Central Ohio Regional MLS
- $199,9003 bd1 ba1.3k sqft580 Henrietta Ave, Logan, OH 43138For SaleMLS ID #226041315, Trudy D Tiu, Walker Tiu Real Estate Group. Columbus and Central Ohio Regional MLS
- $269,9983 bd2 ba1.3k sqft920 Pleasantville Rd, Lancaster, OH 43130For SaleMLS ID #226041878, Cynthia L Stone, Coldwell Banker Realty. Columbus and Central Ohio Regional MLS
- $279,5003 bd3 ba1.5k sqft620 Flora Dr, New Lexington, OH 43764For SaleMLS ID #226041939, Jessica R Bowers, Rise Realty. Columbus and Central Ohio Regional MLS
- $233,9002 bd1 ba910 sqft36006 Hocking Dr, Logan, OH 43138For SaleMLS ID #226031057, Jennifer L Wernert, e-Merge Real Estate. Columbus and Central Ohio Regional MLS
- $299,9003 bd2 ba1.1k sqft36841 Lime Bank Rd, Logan, OH 43138For SaleMLS ID #226028639, Melissa Atkins, Fathom Realty Ohio. Columbus and Central Ohio Regional MLS
- $365,0003 bd3 ba1.4k sqft11100 Frasure Helber Rd, Logan, OH 43138For SaleMLS ID #226037362, Scott Farrar, Plum Tree Realty. Columbus and Central Ohio Regional MLS
- $193,0003 bd2 ba1.1k sqft15000 Pleasant Valley Rd, Logan, OH 43138For SaleMLS ID #226037837, Crissi L Lutz, Red 1 Realty. Columbus and Central Ohio Regional MLS
- $260,0003 bd2 ba1.3k sqft1161 Frederick St, Lancaster, OH 43130For SaleMLS ID #226041616, Christy Vogel, AAG Realty & Auction, LLC. Columbus and Central Ohio Regional MLS
- $325,0002 bd2 ba1.3k sqft34796 Geiger Rd, Logan, OH 43138For SaleMLS ID #226025270, Sherry L Looney, Howard HannaRealEstateServices. Columbus and Central Ohio Regional MLS
- $169,0003 bd1 ba1k sqft65 Falls St, Logan, OH 43138For SaleMLS ID #226032316, Danielle Wolfe, Key Realty. Columbus and Central Ohio Regional MLS
- $259,9002 bd2 ba820 sqft35990 Greasy Ridge Rd, Logan, OH 43138New ConstructionMLS ID #226037995, Tony Coakley, BARTLETT BENNER REALTY. Columbus and Central Ohio Regional MLS
