Welcome to 96 Lombard Street! Tucked away in a New Bedford neighborhood, this three-family property offers an opportunity for investors or buyers exploring owner occupancy with rental income potential. The first and second floors each feature two bedrooms and a double parlor, while the third floor offers one bedroom and a double parlor. Vinyl siding and a fenced backyard add to the property’s appeal, with outdoor space for relaxing or gardening. All three units are currently occupied by tenants at will. A great opportunity to add to your investment portfolio or begin building equity through multifamily ownership! Saturday’s showings are rescheduled due to severe weather.
For sale
Price cut: $49.1K (11/15)
$499,900
96 Lombard St, New Bedford, MA 02740
5beds
2,762sqft
3 Family
Built in 1915
-- sqft lot
$498,900 Zestimate®
$181/sqft
$-- HOA
What's special
Vinyl sidingFenced backyard
- 16 days
- 849
- 31
Likely to sell faster than
Zillow last checked:
Listing updated:
Listed by:
Melisa Gagne 508-264-6905,
RE/MAX Vantage 774-992-0297
Source: MLS PIN,MLS#: 73598152
Facts & features
Interior
Bedrooms & bathrooms
- Bedrooms: 5
- Bathrooms: 3
- Full bathrooms: 3
Features
- Has basement: Yes
- Has fireplace: No
Interior area
- Total structure area: 2,762
- Total interior livable area: 2,762 sqft
- Finished area above ground: 2,762
Property
Features
- Fencing: Fenced/Enclosed
Lot
- Size: 3,202 Square Feet
- Features: Cleared
Details
- Parcel number: M:0029 L:0181,2887006
- Zoning: RC
Construction
Type & style
- Home type: MultiFamily
- Property subtype: 3 Family
Materials
- Foundation: Concrete Perimeter
Condition
- Year built: 1915
Utilities & green energy
- Sewer: Public Sewer
- Water: Public
Community & HOA
Location
- Region: New Bedford
Financial & listing details
- Price per square foot: $181/sqft
- Tax assessed value: $469,600
- Annual tax amount: $5,311
- Date on market: 11/3/2026
- Total actual rent: 5100
Estimated market value
$498,900
$474,000 - $524,000
$1,927/mo
Price history
| Date | Event | Price |
|---|---|---|
| 11/15/2026 | Price change | $499,900-8.9%$181/sqft |
Source: MLS PIN #73598152 Report a problem | ||
| 11/3/2026 | Listed for sale | $549,000+133.6%$199/sqft |
Source: MLS PIN #73598152 Report a problem | ||
| 9/26/2019 | Sold | $235,000-15.8%$85/sqft |
Source: Public Record Report a problem | ||
| 8/15/2019 | Pending sale | $279,000$101/sqft |
Source: Amaral & Associates RE #72529855 Report a problem | ||
| 7/7/2019 | Listed for sale | $279,000$101/sqft |
Source: Amaral & Associates RE #72529855 Report a problem | ||
Public tax history
| Year | Property taxes | Tax assessment |
|---|---|---|
| 2025 | $5,311 +18.9% | $469,600 +26.1% |
| 2024 | $4,468 +10.7% | $372,300 +31.8% |
| 2023 | $4,037 +9.4% | $282,500 +18.9% |
| 2022 | $3,691 +3.5% | $237,500 +3.8% |
| 2021 | $3,565 -3.2% | $228,700 +0.4% |
| 2020 | $3,681 +13.9% | $227,800 +16.1% |
| 2019 | $3,231 +4.4% | $196,200 +5.4% |
| 2018 | $3,095 +6.1% | $186,100 +6.5% |
| 2017 | $2,917 +3.7% | $174,800 +2.5% |
| 2016 | $2,812 +6.9% | $170,500 +2% |
| 2015 | $2,630 +3.7% | $167,200 |
| 2014 | $2,535 -3.1% | $167,200 -8.4% |
| 2013 | $2,615 -0.6% | $182,500 -4.6% |
| 2012 | $2,632 -4.5% | $191,300 -10.6% |
| 2011 | $2,756 -3.3% | $214,000 -9.7% |
| 2010 | $2,850 +2.3% | $236,900 -2.6% |
| 2009 | $2,785 +2.6% | $243,200 -5.5% |
| 2008 | $2,715 +12.6% | $257,300 +10% |
| 2007 | $2,412 +5.5% | $233,900 +11.2% |
| 2006 | $2,287 +4.9% | $210,400 +9.7% |
| 2005 | $2,181 +15.1% | $191,800 +25.2% |
| 2004 | $1,895 +15.3% | $153,200 +36.7% |
| 2003 | $1,643 +8.9% | $112,100 +14.5% |
| 2002 | $1,509 -7.4% | $97,900 -2.5% |
| 2000 | $1,629 -1.7% | $100,400 -19.6% |
| 1996 | $1,657 | $124,900 |
Find assessor info on the county website
Monthly payment
Est. payment
Payment breakdown
Explore the cost of this home by adjusting the details. Changes won't be saved.Climate risks
Neighborhood: 02740
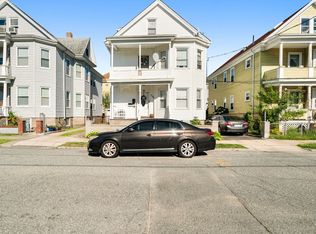
Similar homes
- $465,0005 bd2 ba2.2k sqft436 Rivet St, New Bedford, MA 02740For Sale
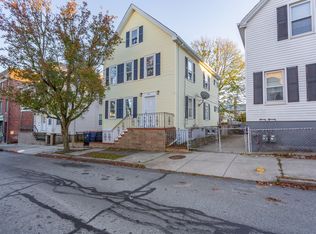 MLS ID #73603275, The Vision Group, Keller Williams South Watuppa. MLS PIN
- $499,9004 bd2 ba1.5k sqft7 Stanton Ct, New Bedford, MA 02740For Sale
 MLS ID #73603571, Kimberly Machado, Heritage Realty. MLS PIN
- $515,0006 bd3 ba3k sqft53 Bedford St, New Bedford, MA 02740For Sale
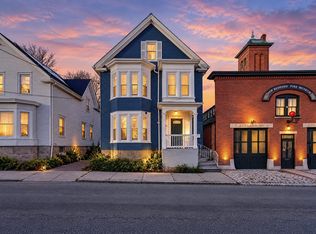 MLS ID #73603737, Bill Thompson, Keller Williams Elite. MLS PIN
- $499,9006 bd2 ba2k sqft343 Purchase St, New Bedford, MA 02740For Sale
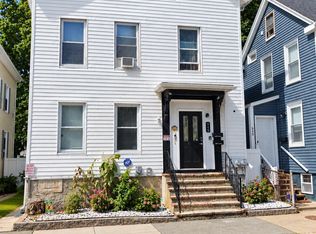 MLS ID #73572453, Michelle Gerez, RE/MAX Impact. MLS PIN
