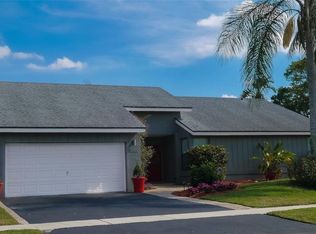
BEAUTIFUL 3 BEDROOM, 2 BATH PLUS DEN OR OFFICE POOL HOME.
This property is off market, which means it's not currently listed for sale or rent on Zillow. This may be different from what's available on other websites or public sources.
$598,400
$557,000 - $640,000
$4,280/mo
$4,280/mo
Rent Zestimate®
Find your next renter with Zillow Rental Manager. Plus, with online applications, you can quickly screen prospective tenants – for free.
$4,280/mo
Rent Zestimate®
$4,095/mo
Est. payment
Refinancing to a lower rate could help reduce your monthly payments and save thousands over the life of the loan.
$4,095/mo
Est. payment
Work with a Zillow partner agent
Leverage their expertise and Zillow's premium Showcase listings to get your home seen by more buyers.
Get startedList with your own agent
Get your home in front of millions of buyers by listing it on Zillow.
Learn how to do itSell it yourself
Take full control of how buyers see your home on Zillow by listing For Sale by Owner (FSBO).
List your homeBEAUTIFUL 3 BEDROOM, 2 BATH PLUS DEN OR OFFICE POOL HOME.
This property is off market, which means it's not currently listed for sale or rent on Zillow. This may be different from what's available on other websites or public sources.
| Date | Event | Price |
|---|---|---|
| 10/5/2016 | Sold | $310,000-6.1%$176/sqft |
Source: | ||
| 6/21/2016 | Listed for sale | $330,000+42.9%$187/sqft |
Source: Florida Brokers Real Estate LL #H10101138 Report a problem | ||
| 12/18/2015 | Listing removed | $2,500$1/sqft |
Source: The Sool's LLC Report a problem | ||
| 10/24/2015 | Listed for rent | $2,500+13.6%$1/sqft |
Source: The Sool's LLC Report a problem | ||
| 11/12/2013 | Listing removed | $2,200$1/sqft |
Source: Exit Ocean Realty Report a problem | ||
| 10/30/2013 | Listed for rent | $2,200$1/sqft |
Source: Exit Ocean Realty Report a problem | ||
| 4/2/2013 | Listing removed | $2,200$1/sqft |
Source: Real Estate Sales Force Report a problem | ||
| 11/9/2012 | Sold | $231,000+31.3%$131/sqft |
Source: Public Record Report a problem | ||
| 9/13/2012 | Sold | $176,000+7.7%$100/sqft |
Source: Public Record Report a problem | ||
| 9/13/2012 | Listed for rent | $2,200$1/sqft |
Source: Floridas Best Realty Report a problem | ||
| 6/22/2012 | Listed for sale | $163,400+19.2%$93/sqft |
Source: GSIG LLC #A1655744 Report a problem | ||
| 3/27/2012 | Sold | $137,100-24%$78/sqft |
Source: Public Record Report a problem | ||
| 11/23/2011 | Listing removed | $180,500$102/sqft |
Source: Sunrirse Real Estate Services #D1376660 Report a problem | ||
| 9/15/2011 | Listed for sale | $180,500$102/sqft |
Source: Tatiana Varon #D1376660 Report a problem | ||
| 4/29/2011 | Listing removed | $180,500$102/sqft |
Source: Sunrise Real Estate Services, #D1376660 Report a problem | ||
| 3/16/2011 | Price change | $180,500-12%$102/sqft |
Source: Sunrise Real Estate Services, #D1376660 Report a problem | ||
| 9/18/2010 | Price change | $205,000-8.9%$116/sqft |
Source: Sunrise Real Estate Services, #D1376660 Report a problem | ||
| 7/17/2010 | Price change | $225,000+9.8%$127/sqft |
Source: SUNRISE REAL ESTATE SERVICES INC. #D1376660 Report a problem | ||
| 5/12/2010 | Listed for sale | $205,000-50.6%$116/sqft |
Source: Sunrirse Real Estate Services #D1376660 Report a problem | ||
| 11/29/2005 | Sold | $415,000+59.6%$235/sqft |
Source: Public Record Report a problem | ||
| 12/4/2003 | Sold | $260,000+85.1%$147/sqft |
Source: Public Record Report a problem | ||
| 10/7/1998 | Sold | $140,500$80/sqft |
Source: Public Record Report a problem | ||
| Year | Property taxes | Tax assessment |
|---|---|---|
| 2025 | $5,024 +3.1% | $321,246 +2.9% |
| 2024 | $4,871 +2.6% | $312,192 +3% |
| 2023 | $4,748 +1% | $303,099 +3% |
| 2022 | $4,703 +0.7% | $294,271 +3% |
| 2021 | $4,668 +0.8% | $285,700 +1.4% |
| 2020 | $4,633 +1.2% | $281,755 +2.3% |
| 2019 | $4,576 | $275,420 +1.9% |
| 2018 | $4,576 +5.2% | $270,285 +2.1% |
| 2017 | $4,349 +1.4% | $264,726 +10.9% |
| 2016 | $4,291 -10.1% | $238,715 +10% |
| 2015 | $4,774 +13.1% | $217,014 +10% |
| 2014 | $4,223 +13% | $197,285 +10% |
| 2013 | $3,738 +31.8% | $179,350 +6.4% |
| 2012 | $2,837 +1.2% | $168,507 +2.8% |
| 2011 | $2,803 +0.2% | $163,992 +1.5% |
| 2010 | $2,797 -17.8% | $161,568 -19% |
| 2009 | $3,401 -23.2% | $199,382 -29% |
| 2008 | $4,426 -13.1% | $280,722 -9.9% |
| 2007 | $5,094 -20.4% | $311,419 -6.4% |
| 2006 | $6,404 | $332,862 +34.9% |
| 2005 | -- | $246,710 +25.7% |
| 2004 | $2,036 +724% | $196,199 +51.2% |
| 2003 | $247 -88.9% | $129,739 +2.4% |
| 2002 | $2,224 +0.7% | $126,698 +1.6% |
| 2001 | $2,208 +4.8% | $124,703 +3% |
| 2000 | $2,107 +12.4% | $121,071 0% |
| 1999 | $1,875 | $121,113 |
Find assessor info on the county website