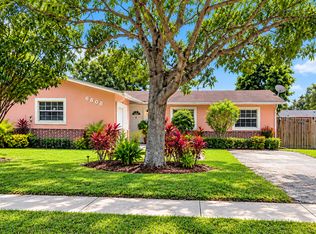
This 1360 square foot single family home has 2 bedrooms and 2.0 bathrooms. This home is located at 9735 NW 76th St, Tamarac, FL 33321.
Pre-foreclosure
Street View
Est. $390,500
9735 NW 76th St, Tamarac, FL 33321
2beds
2baths
1,360sqft
SingleFamily
Built in 1989
2,800 Square Feet Lot
$390,500 Zestimate®
$287/sqft
$115/mo HOA
Overview
- 152 days
- 3
- 0
Facts & features
Interior
Bedrooms & bathrooms
- Bedrooms: 2
- Bathrooms: 2
Features
- Flooring: Tile, Concrete
Interior area
- Total interior livable area: 1,360 sqft
Property
Features
- Exterior features: Stucco, Cement / Concrete
Lot
- Size: 2,800 Square Feet
Details
- Parcel number: 494105161170
Construction
Type & style
- Home type: SingleFamily
Materials
- masonry
- Foundation: Other
- Roof: Shake / Shingle
Condition
- Year built: 1989
Community & HOA
HOA
- Has HOA: Yes
- HOA fee: $115 monthly
Location
- Region: Tamarac
Financial & listing details
- Price per square foot: $287/sqft
- Tax assessed value: $345,470
- Annual tax amount: $8,188
Foreclosure details
Estimated market value
$390,500
$371,000 - $410,000
$2,383/mo
Price history
| Date | Event | Price |
|---|---|---|
| 9/1/2023 | Sold | $385,000-2.5%$283/sqft |
Source:  MIAMI #A11424424 Report a problem | ||
| 7/28/2023 | Pending sale | $395,000$290/sqft |
Source: MIAMI #A11424424 Report a problem | ||
| 7/25/2023 | Listed for sale | $395,000+154.8%$290/sqft |
Source: MIAMI #A11424424 Report a problem | ||
| 6/27/2014 | Sold | $155,000+3.3%$114/sqft |
Source: Public Record Report a problem | ||
| 6/24/2003 | Sold | $150,000+78.6%$110/sqft |
Source: Public Record Report a problem | ||
| 8/26/1998 | Sold | $84,000+42.5%$62/sqft |
Source: Public Record Report a problem | ||
| 1/1/1990 | Sold | $58,929$43/sqft |
Source: Public Record Report a problem | ||
Public tax history
| Year | Property taxes | Tax assessment |
|---|---|---|
| 2025 | $8,188 +7.6% | $345,470 +8.5% |
| 2024 | $7,608 +134.4% | $318,540 +107.3% |
| 2023 | $3,246 +7.1% | $153,680 +3% |
| 2022 | $3,032 +2.4% | $149,210 +3% |
| 2021 | $2,960 +1.6% | $144,870 +1.4% |
| 2020 | $2,914 +1.9% | $142,870 +2.3% |
| 2019 | $2,859 | $139,660 +1.9% |
| 2018 | $2,859 +3.3% | $137,060 +2.1% |
| 2017 | $2,768 +1.4% | $134,250 +2.1% |
| 2016 | $2,729 +0.3% | $131,490 +0.7% |
| 2015 | $2,721 +84.5% | $130,580 +41.4% |
| 2014 | $1,475 | $92,320 -3.8% |
| 2013 | $1,475 -9.5% | $95,980 +7.3% |
| 2012 | $1,629 +37.1% | $89,440 -7.7% |
| 2011 | $1,188 -0.8% | $96,850 -2.7% |
| 2010 | $1,198 -24.6% | $99,570 -16.6% |
| 2009 | $1,588 -16.5% | $119,460 -12.4% |
| 2008 | $1,901 -9.1% | $136,330 +3% |
| 2007 | $2,092 -6.7% | $132,360 +2.5% |
| 2006 | $2,241 | $129,140 +3% |
| 2005 | -- | $125,380 +3% |
| 2004 | $2,228 +60% | $121,730 +62.7% |
| 2003 | $1,392 +5.2% | $74,800 +2.4% |
| 2002 | $1,323 +2.6% | $73,050 +1.6% |
| 2001 | $1,290 +4.2% | $71,900 |
| 2000 | $1,237 | -- |
Find assessor info on the county website
Monthly payment
Climate risks
Neighborhood: 33321
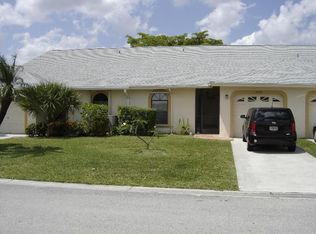
Similar homes
- $--3 bd2 ba1.1k sqft1322 SW 74th Ave, North Lauderdale, FL 33068Auction
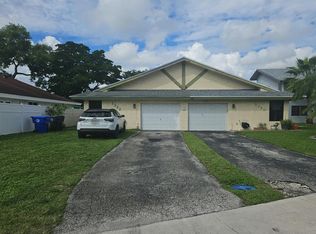 Auction.com 2
- $399,9002 bd2 ba1.3k sqft2451 ARAGON Boulevard #1, Sunrise, FL 33322For Sale
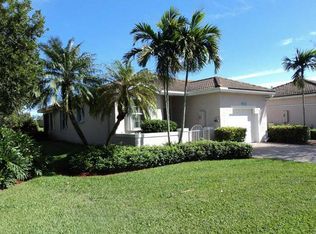
 MLS ID #B26085265, John M James, LoKation. BeachesMLS
- $339,0002 bd2 ba1.4k sqft7110 NW 73rd Avenue, Tamarac, FL 33321For Sale
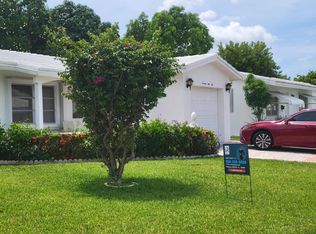 MLS ID #B26030689, Lema C Lamey, Lema's Realty LLC. BeachesMLS
- $430,0003 bd2 ba1.3k sqft6808 MERION Court, North Lauderdale, FL 33068For Sale
 MLS ID #B26090234, Anthony A Masso, Lamar Properties Inc. BeachesMLS
- $450,0002 bd2 ba1.6k sqft6100 NW 73rd Terrace, Tamarac, FL 33321For SaleMLS ID #B26035967, Marielle Michel, United Realty Group Inc. BeachesMLS
- $318,0002 bd2 ba1.2k sqft1170 NW 90th Avenue, Plantation, FL 33322For SaleMLS ID #B26090285, Khalilah Beverley, Grand Luxe Realty Inc. BeachesMLS
- $420,0003 bd3 ba1.5k sqft3783 NW 91ST Lane #3783, Sunrise, FL 33351For SaleMLS ID #B26089684, Fenick Jean, Dalton Wade Inc. BeachesMLS
- $499,0004 bd2 ba1.8k sqftSunflower, Fort Lauderdale, FL 33321For Sale
 MLS ID #A12083946, Ariya Mobed, Mobed Realty, P.A.. MIAMI
- $389,9004 bd2 ba1.6k sqft6970 NW 17th Court, Margate, FL 33063For SaleMLS ID #B26079070, Ronald Point-Dujour, Perspicacity Realty & Investments, CORP. BeachesMLS
- $413,0004 bd2 ba1.3k sqftBroadview Country Club, Pompano Beach, FL 33068For SaleMLS ID #A11955971, Dayana Herrera, Melin Realty LLC. MIAMI
- $379,0003 bd2 ba1.1k sqftParadise Gardens Sec Two, Pompano Beach, FL 33063For SaleMLS ID #A12090432, Madyuri Faze, Faze Realty. MIAMI
- $280,0003 bd3 ba1.4k sqftJasmine At Woodmont, Tamarac, FL 33321For SaleMLS ID #A11892760, Desiree Perez-Jarvis, Lifestyle International Realty. MIAMI
- $409,0002 bd2 ba1.1k sqft7160 NW 24th Street NW, Sunrise, FL 33313For SaleMLS ID #B26033573, Julio Frias, Allstar Realty Inc. BeachesMLS
- $450,0003 bd2 ba1.4k sqftNorth Lauderdale Landings, North Lauderdale, FL 33068For SaleMLS ID #A12066428, Duriel Taylor, Compass Florida, LLC. MIAMI
