Home has been updated since 2012. New tiled showers with rain shower heads and glass doors for new look. Dining Room has built in cabinets, newer cabinets, and appliances in kitchen. Patio enclosed for Sun Room/AZ Room which opens the back area up to make it lite & bright. Motorized awning if you prefer shade on patio and AZ Room. Furnishings available outside of escrow.Units cannot be rented but one pet per unit is ok.New hot water heater 10-26-2016.
Pre-foreclosure
Est. $216,200
9970 W Royal Oak Rd APT Q, Sun City, AZ 85351
2beds
1,318sqft
Condo
Built in 1972
-- sqft lot
$216,200 Zestimate®
$164/sqft
$169/mo HOA
Overview
- 19 days
- 5
- 0
Facts & features
Interior
Bedrooms & bathrooms
- Bedrooms: 2
- Bathrooms: 2
- Full bathrooms: 2
Heating
- Other
Cooling
- Refrigerator
Appliances
- Included: Dishwasher, Range / Oven, Refrigerator
Features
- Flooring: Tile, Carpet
Interior area
- Total interior livable area: 1,318 sqft
Property
Parking
- Parking features: Garage - Attached
Features
- Exterior features: Wood
Lot
- Size: 226 Square Feet
Details
- Parcel number: 20082462
Construction
Type & style
- Home type: Condo
Materials
- Roof: Other
Condition
- Year built: 1972
Community & HOA
HOA
- Has HOA: Yes
- HOA fee: $169 monthly
Location
- Region: Sun City
Financial & listing details
- Price per square foot: $164/sqft
- Tax assessed value: $186,100
- Annual tax amount: $230
Foreclosure details
Estimated market value
$216,200
$201,000 - $231,000
$1,466/mo
Price history
| Date | Event | Price |
|---|---|---|
| 2/26/2026 | Listing removed | $214,700$163/sqft |
Source:  ARMLS #6979305 Report a problem | ||
| 2/4/2026 | Listed for sale | $214,700-11.7%$163/sqft |
Source: ARMLS #6979305 Report a problem | ||
| 4/12/2023 | Sold | $243,250+3.6%$185/sqft |
Source: ARMLS #6514891 Report a problem | ||
| 2/18/2023 | Price change | $234,900-5.2%$178/sqft |
Source: ARMLS #6514891 Report a problem | ||
| 2/6/2023 | Price change | $247,900-2.7%$188/sqft |
Source: ARMLS #6514891 Report a problem | ||
| 2/1/2023 | Listed for sale | $254,900+18.1%$193/sqft |
Source: ARMLS #6514891 Report a problem | ||
| 5/19/2021 | Sold | $215,900-1.8%$164/sqft |
Source: ARMLS #6204975 Report a problem | ||
| 4/22/2021 | Pending sale | $219,900$167/sqft |
Source: ARMLS #6204975 Report a problem | ||
| 3/31/2021 | Price change | $219,900-2.2%$167/sqft |
Source: ARMLS #6204975 Report a problem | ||
| 3/11/2021 | Listed for sale | $224,900+105.2%$171/sqft |
Source: ARMLS #6204975 Report a problem | ||
| 12/9/2016 | Sold | $109,600$83/sqft |
Source: ARMLS #5517540 Report a problem | ||
| 10/28/2016 | Listed for sale | $109,600+85.8%$83/sqft |
Source: RE/MAX Professionals #5517540 Report a problem | ||
| 2/7/2012 | Sold | $59,000-5.6%$45/sqft |
Source: ARMLS #4707200 Report a problem | ||
| 1/27/2012 | Listed for sale | $62,500-21.9%$47/sqft |
Source: Coldwell Banker Residential Brokerage #4707200 Report a problem | ||
| 4/2/2002 | Sold | $80,000+13.5%$61/sqft |
Source: Public Record Report a problem | ||
| 2/20/1998 | Sold | $70,500$53/sqft |
Source: Public Record Report a problem | ||
Public tax history
| Year | Property taxes | Tax assessment |
|---|---|---|
| 2025 | $230 +4.9% | $18,610 -10% |
| 2024 | $219 +1.7% | $20,680 +184.8% |
| 2023 | $215 -63.8% | $7,260 -48.4% |
| 2022 | $595 +9.9% | $14,060 +9.8% |
| 2021 | $542 +2.4% | $12,800 +13% |
| 2020 | $529 +5.7% | $11,330 +16.4% |
| 2019 | $500 | $9,730 +13.4% |
| 2018 | $500 +4.6% | $8,580 +19.2% |
| 2017 | $478 +9.4% | $7,200 +19% |
| 2016 | $437 +4.8% | $6,050 +4.9% |
| 2015 | $417 | $5,770 +23.3% |
| 2014 | -- | $4,680 +4% |
| 2013 | -- | $4,500 -17.4% |
| 2012 | -- | $5,450 -9.9% |
| 2011 | -- | $6,050 -22.4% |
| 2010 | -- | $7,800 -21.2% |
| 2009 | -- | $9,900 -10.4% |
| 2008 | -- | $11,050 +7.3% |
| 2007 | -- | $10,300 +79.1% |
| 2006 | -- | $5,750 |
| 2005 | -- | $5,750 +2.7% |
| 2004 | -- | $5,600 |
| 2003 | -- | $5,600 -0.9% |
| 2002 | -- | $5,650 |
Find assessor info on the county website
Monthly payment
Climate risks
Neighborhood: 85351
- $177,6002 bd2 ba1.3k sqft9970 W Royal Oak Rd APT J, Sun City, AZ 85351Off Market

- $146,0001 bd1 ba879 sqft9970 W Royal Oak Rd APT K, Sun City, AZ 85351Off Market

- $231,5003 bd1 ba1.5k sqft9970 W Royal Oak Rd APT N, Sun City, AZ 85351Off Market

- $189,900-- bd2 ba1.3k sqft9970 W Royal Oak Rd APT P, Sun City, AZ 85351Off Market
Similar homes
- $200,0002 bd2 ba1.3k sqft10022 W LANCASTER Drive, Sun City, AZ 85351For Sale
 MLS ID #7096278, Annette Sharp, HomeSmart. ARMLS
- $227,0002 bd2 ba1.4k sqft10227 N 108TH Avenue, Sun City, AZ 85351For Sale
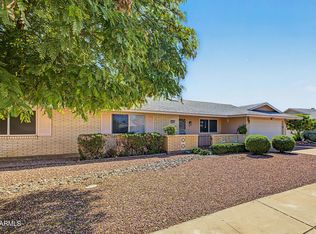 MLS ID #7089709, Lorri Morin, Keller Williams, Professional Partners. ARMLS
- $195,9002 bd2 ba1.3k sqft13082 N 100TH Drive N, Sun City, AZ 85351For Sale
 MLS ID #7029782, Ruth M Blue, West USA Realty. ARMLS
- $235,5002 bd2 ba1.3k sqft10309 W CORTE DEL SOL ESTE --, Sun City, AZ 85351For Sale
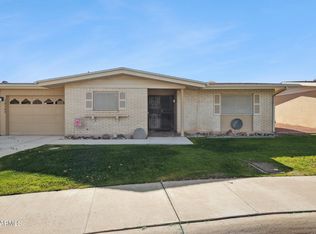 MLS ID #7089246, Bruce A Swartz, HomeSmart. ARMLS
