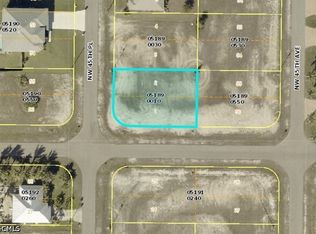
Rare chance to own a cul-de-sac lot! No through traffic! Located in a tucked away corner of northwest Cape Coral. Fabulous Western Exposure, perfect for viewing our incredible sunsets. Visit nearby parks such as the new Crystal Lake Park that has a boat ramp, work out stations, gorgeous lake, and views of Charlotte Harbor. Conveniently located near Burnt Store Rd, Burnt Store Marina, restaurants, multiple golf courses, and so much more!
Active
Price cut: $5K (10/14)
$45,000
Cape Coral, FL 33993
--beds
--baths
10,280Square Feet
Unimproved Land
Built in ----
10,280 Square Feet Lot
$-- Zestimate®
$--/sqft
$-- HOA
What's special
Fabulous western exposureCul-de-sac lot
- 189 days
- 5
- 1
Zillow last checked:
Listing updated:
Listed by:
Michelle Ballantine 239-565-2555,
Century 21 Selling Paradise
Source: Florida Gulf Coast MLS,MLS#: 2026021823 Originating MLS: Florida Gulf Coast
Facts & features
Interior
Video & virtual tour
Property
Features
- Waterfront features: None
Lot
- Size: 10,280 Square Feet
- Dimensions: 93 x 125 x 116 x 100
- Features: Cul-De-Sac, Irregular Lot, Oversized Lot
Details
- Parcel number: 184323C405529.0140
- Lease amount: $0
- Zoning description: R1-D
Utilities & green energy
- Sewer: None
- Water: None
- Utilities for property: Other, Sewer Not Available, Water Not Available
Community & HOA
Community
- Features: None
- Condo and coop fee: $0
- Membership fee: $0
- Subdivision: CAPE CORAL
HOA
- Amenities included: None
- Services included: None
Location
- Region: Cape Coral
Financial & listing details
- Annual tax amount: $741
- Date on market: 5/16/2026
- Cumulative days on market: 189 days
- Listing terms: All Financing Considered,Cash
- Road surface type: Paved
Estimated market value
Not available
Estimated sales range
Not available
Not available
Price history
| Date | Event | Price |
|---|---|---|
| 10/14/2026 | Price change | $45,000-10% |
Source:  Florida Gulf Coast MLS #2026021823 Report a problem | ||
| 5/16/2026 | Listed for sale | $50,000+566.7% |
Source: Florida Gulf Coast MLS #2026021823 Report a problem | ||
| 5/30/2019 | Sold | $7,500-3.8% |
Source: Florida Gulf Coast MLS #219030307 Report a problem | ||
| 5/3/2019 | Pending sale | $7,800 |
Source: MVP Realty Associates LLC #219030307 Report a problem | ||
| 4/22/2019 | Listed for sale | $7,800-54.2% |
Source: MVP Realty Associates LLC #219030307 Report a problem | ||
| 1/7/2014 | Sold | $17,048-4.8% |
Source: Public Record Report a problem | ||
| 8/12/2013 | Listed for sale | $17,900+155.7% |
Source: Owner Report a problem | ||
| 6/28/2013 | Sold | $7,000+40% |
Source: Public Record Report a problem | ||
| 7/10/2009 | Sold | $5,000-95.2% |
Source: Public Record Report a problem | ||
| 10/3/2006 | Sold | $105,000+1135.3% |
Source: Public Record Report a problem | ||
| 3/18/2004 | Sold | $8,500 |
Source: Public Record Report a problem | ||
Public tax history
| Year | Property taxes | Tax assessment |
|---|---|---|
| 2025 | $741 +1.1% | $9,664 +10% |
| 2024 | $733 +4.9% | $8,785 +10% |
| 2023 | $699 +31.7% | $7,986 +10% |
| 2022 | $531 +13% | $7,260 +10% |
| 2021 | $469 +7.4% | $6,600 +10% |
| 2020 | $437 -6% | $6,000 -35.5% |
| 2019 | $465 | $9,300 |
| 2018 | $465 +2.2% | $9,300 +28% |
| 2017 | $455 +11% | $7,268 +15.4% |
| 2016 | $410 +9.1% | $6,300 +5% |
| 2015 | $376 +8.2% | $6,000 +10.1% |
| 2014 | $347 +21.1% | $5,452 +39.8% |
| 2013 | $287 +55.6% | $3,900 +11.4% |
| 2012 | $184 -7.8% | $3,500 -20.5% |
| 2011 | $200 -18.1% | $4,400 -27.9% |
| 2010 | $244 -5.9% | $6,100 -15.3% |
| 2009 | $260 -20% | $7,200 -52% |
| 2008 | $325 -44.7% | $15,000 -50% |
| 2007 | $588 -56.8% | $30,000 -58.3% |
| 2006 | $1,360 +355.1% | $72,000 +496% |
| 2004 | $299 +200.9% | $12,080 +322.4% |
| 2003 | $99 -30% | $2,860 +94.6% |
| 2002 | $142 | $1,470 -36.4% |
| 2000 | -- | $2,310 |
Monthly payment
Climate risks
Neighborhood: 33993
Similar homes
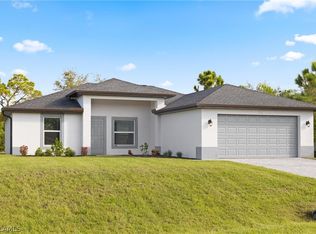
- $45,00010,497 sqft2801 NW 45th Pl, Cape Coral, FL 33993Lot/Land
 MLS ID #2026046305, Stacey Bohannon, KW Florida Living. Florida Gulf Coast MLS
- $50,00010,018 sqft3729 NW 38th Ave, Cape Coral, FL 33993Lot/Land
 MLS ID #2026022824, Dimitri Evans, KW Florida Living. Florida Gulf Coast MLS
- $45,00010,018 sqft4117 NW 38th Ter, Cape Coral, FL 33993Lot/Land
 MLS ID #2025009943, Eileen Rodriguez, Realty One Group MVP. Florida Gulf Coast MLS
- $54,00010,019 sqft3902 NW 41ST LANE LOT 26, CAPE CORAL, FL 33993Lot/Land

 MLS ID #C7528543, Tammy Breden, KELLER WILLIAMS ISLAND LIFE REAL ESTATE. Stellar MLS
- $45,00010,018 sqft3213 NW 41st Pl, Cape Coral, FL 33993Lot/LandMLS ID #2025009939, Eileen Rodriguez, Realty One Group MVP. Florida Gulf Coast MLS
- $42,00010,018 sqft3905 Caloosa Pkwy N, Cape Coral, FL 33993Lot/LandMLS ID #2025025336, Brian Smallwood, Sellstate 5 Star Realty. Florida Gulf Coast MLS
- $48,00010,018 sqft3815 NW 41st Ter, Cape Coral, FL 33993Lot/LandMLS ID #222076719, John Moffatt, Sun Coast Global, Inc.. Florida Gulf Coast MLS
- $46,00010,018 sqft4106 NW 39th ST, CAPE CORAL, FL 33993Lot/Land
 MLS ID #225082510, Eduardo Arriagada, Century 21 Tenace Realty. SWFLMLS
- $50,0000.35 acres3700 NW 45th St, Cape Coral, FL 33993Lot/LandMLS ID #2026037575, Lisa Sivertsen, John R. Wood Properties. Florida Gulf Coast MLS
- $38,00010,018 sqft4012 NW 38th Ln, Cape Coral, FL 33993Lot/LandMLS ID #2026033688, Sharon Decker, RE/MAX Nautical Realty. Florida Gulf Coast MLS
- $39,00010,628 sqft3403 NW 4th TER, CAPE CORAL, FL 33993Lot/LandMLS ID #226041136, Matthew Simon, Waterfront Realty Group Inc. SWFLMLS
- $45,00010,498 sqft2801 NW 45TH PLACE LOT 1, CAPE CORAL, FL 33993Lot/LandMLS ID #C7519107, Jessica Nolan, KW FLORIDA LIVING. Stellar MLS
- $42,0000.34 acres3401 NW 7th Ter, Cape Coral, FL 33993Lot/LandMLS ID #2026045442, Patrick Reid, RE/MAX Realty Team. Florida Gulf Coast MLS
- $48,00010,018 sqft1719 NW 19th St, Cape Coral, FL 33993Lot/LandMLS ID #2026045614, Cory Lauer, EXP Realty LLC. Florida Gulf Coast MLS
- $39,90010,018 sqft4209 NW 34th St, Cape Coral, FL 33993Lot/LandMLS ID #2026034694, Smitty Smith, ERA Cape Realty. Florida Gulf Coast MLS
- $43,00010,497 sqft2309 NW 34th Ave, Cape Coral, FL 33993Lot/LandMLS ID #2026017174, Carolina Tiuso, Tiuso Realty Group. Florida Gulf Coast MLS
- $52,90010,018 sqft3515 NW 42nd Ave, Cape Coral, FL 33993Lot/LandMLS ID #2026026289, Victoria Corby, Realty One Group MVP. Florida Gulf Coast MLS
- $52,5000.34 acres3022 NW 41st Pl, Cape Coral, FL 33993Lot/LandMLS ID #2026021435, David Rhinehart, Starlink Realty, Inc. Florida Gulf Coast MLS
- $54,00010,018 sqft4218 NW 35th St, Cape Coral, FL 33993Lot/LandMLS ID #2026017329, Lillyam Hernandez, Hustle Bees Realty LLC. Florida Gulf Coast MLS
- $35,00010,628 sqft2917 NW 25th Ter, Cape Coral, FL 33993Lot/LandMLS ID #2026045725, Arturo Sanchez Caram, Starlink Realty, Inc. Florida Gulf Coast MLS
