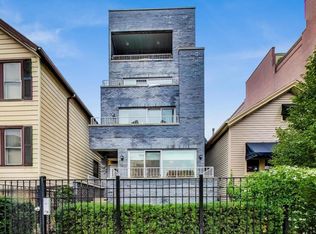
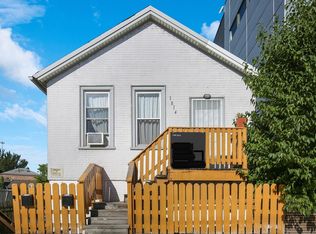
$545,000
2 bd|1 ba|1.7k sqft
1418 W Grand Ave, Chicago, IL 60642
Off Market
Zillow last checked:
Listing updated:
Peter Fotopoulos, PSA,SFR 312-242-1000,
Baird & Warner
Not available
Estimated sales range
Not available
$2,319/mo
| Date | Event | Price |
|---|---|---|
| 5/31/2026 | Price change | $599,000 |
Source: MRED as distributed by MLS GRID #12210423 Report a problem | ||
| 5/23/2026 | Price change | -- |
Source: MRED as distributed by MLS GRID #12210423 Report a problem | ||
| 5/22/2026 | Price change | $599,000 |
Source: | ||
| 4/25/2026 | Price change | -- |
Source: MRED as distributed by MLS GRID #12210423 Report a problem | ||
| 11/14/2024 | Listed for sale | $599,000-7.7% |
Source: | ||
| 8/17/2024 | Listing removed | $649,000 |
Source: | ||
| 7/27/2024 | Price change | $649,000-7.2% |
Source: | ||
| 7/12/2024 | Listed for sale | $699,000+33.1% |
Source: | ||
| 10/8/2021 | Sold | $525,000-4.5% |
Source: | ||
| 10/7/2021 | Pending sale | $550,000 |
Source: | ||
| 8/19/2021 | Contingent | $550,000 |
Source: | ||
| 8/3/2021 | Price change | $550,000-8.3% |
Source: | ||
| 7/19/2021 | Listed for sale | $600,000 |
Source: | ||
| 6/10/2021 | Contingent | $600,000 |
Source: | ||
| 2/28/2021 | Price change | $600,000-11.1% |
Source: | ||
| 12/11/2020 | Listed for sale | $675,000 |
Source: @properties #10951752 Report a problem | ||
| Year | Property taxes | Tax assessment |
|---|---|---|
| 2024 | -- | $23,281 +24.2% |
| 2023 | $3,968 -37% | $18,750 -38.7% |
| 2022 | $6,294 +1357.7% | $30,600 -60.8% |
| 2021 | $432 -3.1% | $78,000 +31.3% |
| 2020 | $446 +0.3% | $59,391 -11% |
| 2019 | $444 +1.5% | $66,732 |
| 2018 | $437 -6.6% | $66,732 +47% |
| 2017 | $468 -47.3% | $45,386 |
| 2016 | $889 +4% | $45,386 |
| 2015 | $855 +0.9% | $45,386 +12.6% |
| 2014 | $847 -0.4% | $40,318 |
| 2013 | $850 +6.8% | $40,318 |
| 2012 | $796 +1% | $40,318 -17.5% |
| 2011 | $788 +10.6% | $48,858 |
| 2010 | $712 +6.6% | $48,858 |
| 2009 | $668 -7.1% | $48,858 -3.7% |
| 2008 | $720 -9.6% | $50,742 |
| 2007 | $796 -5.8% | $50,742 |
| 2006 | $846 -14% | $50,742 +34.4% |
| 2005 | $984 -4.8% | $37,764 |
| 2004 | $1,033 -78% | $37,764 |
| 2003 | $4,689 +8.2% | $37,764 +45.5% |
| 2002 | $4,334 +105.6% | $25,947 |
| 2001 | $2,108 +41.6% | $25,947 |
| 2000 | $1,489 -38% | $25,947 +66% |
| 1999 | $2,402 | $15,630 |
Source: MRED as distributed by MLS GRID. This data may not be complete. We recommend contacting the local school district to confirm school assignments for this home.
A local agent can set up tours, give advice and negotiate with sellers.