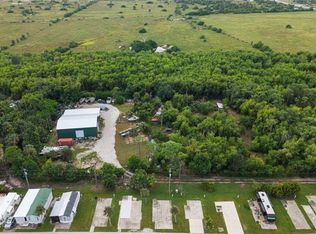
One of two adjoining lots for sale zoned AG-2. This property is located in scenic Saint James city and is currently an active palm tree farm with many field planted trees. The palms go with the property for added value and have the potential to produce income. Don't miss out! Resell or leave them as landscaping and privacy, giving the property a tropical feel. City water is available.
Active
$99,000
Corner Lot, Saint James City, FL 33956
--beds
--baths
0.95Acres
Unimproved Land
Built in ----
0.95 Acres Lot
$-- Zestimate®
$--/sqft
$-- HOA
What's special
- 92 days
- 47
- 9
Zillow last checked:
Listing updated:
Listed by:
Matt Carter 239-478-4544,
Greider Realty
Source: Florida Gulf Coast MLS,MLS#: 2026032392 Originating MLS: Florida Gulf Coast
Facts & features
Interior
Video & virtual tour
Property
Features
- Waterfront features: None
Lot
- Size: 0.95 Acres
- Features: Oversized Lot, Acreage
Details
- Parcel number: 0345220100000.1880
- Lease amount: $0
- Zoning description: AG-2
Utilities & green energy
- Sewer: None
- Water: None
- Utilities for property: Electricity Available, Water Available, Sewer Not Available, Water Not Available
Community & HOA
Community
- Features: Non-Gated
- Condo and coop fee: $0
- Membership fee: $0
- Subdivision: GULF SHORES ESTATES
HOA
- Amenities included: None
- Services included: None
Location
- Region: Saint James City
Financial & listing details
- Tax assessed value: $62,910
- Annual tax amount: $834
- Date on market: 8/13/2026
- Cumulative days on market: 93 days
- Listing terms: All Financing Considered,Cash
- Electric utility on property: Yes
Estimated market value
Not available
Estimated sales range
Not available
Not available
Price history
| Date | Event | Price |
|---|---|---|
| 8/13/2026 | Listed for sale | $99,000+296% |
Source:  Florida Gulf Coast MLS #2026032392 Report a problem | ||
| 5/29/2021 | Listing removed | -- |
Source:  RE/MAX International Report a problem | ||
| 7/22/2020 | Sold | $25,000-28.4% |
Source: Public Record Report a problem | ||
| 5/29/2020 | Listed for sale | $34,900 |
Source: RE/MAX Trend #220032222 Report a problem | ||
| 4/5/2020 | Listing removed | $34,900 |
Source: RE/MAX Trend #219025681 Report a problem | ||
| 4/5/2019 | Listed for sale | $34,900 |
Source: RE/MAX Trend #219025724 Report a problem | ||
| 6/16/2017 | Sold | $34,900+99.4% |
Source:  Florida Gulf Coast MLS #217031460 Report a problem | ||
| 9/2/2016 | Sold | $17,500 |
Source: Florida Gulf Coast MLS #216020611 Report a problem | ||
Public tax history
| Year | Property taxes | Tax assessment |
|---|---|---|
| 2025 | $834 -6.7% | $53,455 +10% |
| 2024 | $894 +30.2% | $48,595 +10% |
| 2023 | $686 +16.8% | $44,177 +24.3% |
| 2022 | $588 +7.1% | $35,532 +41.6% |
| 2021 | $549 +53.6% | $25,098 +17.1% |
| 2020 | $357 +3.5% | $21,432 -14.6% |
| 2019 | $345 | $25,098 +9.4% |
| 2018 | $345 +7.6% | $22,936 -1% |
| 2017 | $321 +1.8% | $23,175 -1.4% |
| 2016 | $315 +1.7% | $23,500 +49.7% |
| 2015 | $310 +30% | $15,698 +7.1% |
| 2014 | $238 +7.4% | $14,664 +33.3% |
| 2013 | $222 +8.5% | $10,998 -10% |
| 2012 | $204 -36.1% | $12,220 -35% |
| 2011 | $320 -18.3% | $18,800 -16.7% |
| 2010 | $391 -16.4% | $22,560 -20% |
| 2009 | $468 -58.3% | $28,200 -60% |
| 2008 | $1,122 -31.1% | $70,500 -31.8% |
| 2007 | $1,628 +17.9% | $103,400 +22.2% |
| 2006 | $1,381 +156.7% | $84,600 +195.1% |
| 2004 | $538 +91.5% | $28,670 +96.8% |
| 2003 | $281 | $14,570 |
Find assessor info on the county website
Monthly payment
Climate risks
Neighborhood: 33956


Similar homes
- $129,9001.04 acres5030 Stringfellow RD, ST. JAMES CITY, FL 33956Lot/Land
 MLS ID #226039041, Kevin Bartlett, Knowledge Base Real Estate. SWFLMLS
- $99,0000.94 acres4531 Woodstock Rd, Saint James City, FL 33956Lot/Land

 MLS ID #2026032373, Matt Carter, Greider Realty. Florida Gulf Coast MLS
- $99,0000.94 acres4695 Gulf Shore Rd, Saint James City, FL 33956Lot/Land
 MLS ID #2026020410, Debra Jennings, Alliance Realty Group. Florida Gulf Coast MLS
- $89,9003.21 acres5516 Sabal Ave, Saint James City, FL 33956Lot/Land
 MLS ID #133367, Preston Miller, Southern Land & Homes. NFMLS
- $98,0000.63 acres3561 Pink Ibis Dr, Saint James City, FL 33956Lot/LandMLS ID #2026042800, Aimee Gantt, Luxury Real Estate Group LLC. Florida Gulf Coast MLS
- $84,9001.24 acres9437 TREASURE LAKE COURT LOT 5, ST JAMES CITY, FL 33956Lot/Land
 MLS ID #C7515374, Kevin Daly, CENTURY 21 SUNBELT REALTY. Stellar MLS
- $84,9001.24 acres9437 Treasure Lake Court St, James City, FL 33956New ConstructionMLS ID #2025011910, Kevin Daly, Century 21 Sunbelt Realty. Florida Gulf Coast MLS
- $82,0000.94 acres4549 Gulf Shore Rd, Saint James City, FL 33956Lot/LandMLS ID #2026036940, Lori Caldwell, LoKation. Florida Gulf Coast MLS
- $75,0001 acre4235 Berkshire Rd, Saint James City, FL 33956Lot/LandMLS ID #2026025900, Terri James, John R. Wood Properties. Florida Gulf Coast MLS
- $79,9990.79 acres9431 TREASURE LAKE COURT LOT 0040, ST JAMES CITY, FL 33956Lot/LandMLS ID #W7887673, Ross Hardy, RE/MAX MARKETING SPECIALISTS. Stellar MLS
- $129,0001 acre4442 COURTNEY ROAD LOT 111, ST JAMES CITY, FL 33956Lot/LandMLS ID #C7521746, Alden Richter, JR, JOHN R. WOOD PROPERTIES. Stellar MLS
- $99,9009,583 sqft5008 Sandpiper Dr, Saint James City, FL 33956Lot/LandMLS ID #2026010281, Marian Faulkner, Century 21 Sunbelt Realty. Florida Gulf Coast MLS
- $60,0000.5 acres8715 Yukon Ct, Saint James City, FL 33956Lot/LandMLS ID #2026038483, Lisa Wilson, John R. Wood Properties. Florida Gulf Coast MLS
- $89,9000.33 acres4809 Sandpiper Dr, Saint James City, FL 33956Lot/LandMLS ID #2026000963, Gary Walker, Islander Realty. Florida Gulf Coast MLS
- $105,0004,007 sqft5004 Gulfgate Ln, Saint James City, FL 33956Lot/LandMLS ID #2026007790, Michael Shevlin, Century 21 Sunbelt Realty. Florida Gulf Coast MLS
- $49,9000.29 acres5750 Stringfellow Rd, Saint James City, FL 33956Lot/LandMLS ID #2026033369, Destiny Ramming, RE/MAX Realty Team. Florida Gulf Coast MLS
- $55,0000.29 acres2507 Baybreeze St, Saint James City, FL 33956Lot/LandMLS ID #2026047189, Julie Hatton, John R. Wood Properties. Florida Gulf Coast MLS
- $59,0004,835 sqft4920 Flamingo Dr, Saint James City, FL 33956Lot/LandMLS ID #2026044119, Lois Lemke, Experience Real Estate Group. Florida Gulf Coast MLS
