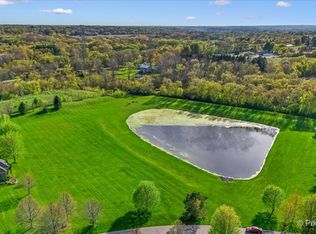
THIS IS A BEAUTIFUL 3.5 ACRE PIECE OF LAND ZONED MULTIFAMILY AND READY FOR A MINIMUM OF 10 UNIT'S AND POSSABLY MORE. CITY SEWER AND WATER AVAILABLE. IN THE VILLAGE & WITHIN WALKING DISTANCE TO TOWN, SCHOOLS, SHOPPING, TRAIN AND ALL ANTIOCH HAS TO OFFER. THERE IS ONE PIN NUMBER BUT 3 TOTAL LOTS. IF YOU ARE LOOKING TO BUILD CONDO'S, TOWNHOMES, OR APARTMENTS THIS IS THE PARCEL. WATERVIEW,S AND ACCESS TO MARINA'S TO THE CHAIN O LAKES RIGHT ACROSS THE STREET.
Active
$199,900
Highview Dr, Antioch, IL 60002
--beds
--baths
3.52Acres
Unimproved Land
Built in ----
3.52 Acres Lot
$-- Zestimate®
$--/sqft
$-- HOA
What's special
In the village
- --
- 99
- views
- 5
- saves
Zillow last checked:
Listing updated:
Listed by:
Jack Fields, GRI (847)395-1010,
Realty World Tiffany R.E.
Source: MRED as distributed by MLS GRID,MLS#: 12757728
Facts & features
Property
Features
- Has view: Yes
- View description: Back of Property, Front of Property, Side(s) of Property
- Has water view: Yes
- Water view: Back of Property,Front of Property,Side(s) of Property
- Frontage length: 375
Lot
- Size: 3.52 Acres
- Dimensions: 375 X 292 X 600 X 128 X 75 X 65 X 308
Details
- Parcel number: 02073010060000
- Zoning: MULTI
- Special conditions: None
Utilities & green energy
- Utilities for property: Electricity Nearby, Natural Gas Nearby, Sewer Nearby, Water Nearby
Community & HOA
Location
- Region: Antioch
Financial & listing details
- Tax assessed value: $119,022
- Annual tax amount: $4,173
- Date on market: 9/12/2026
- Ownership: Fee Simple
- Road surface type: Asphalt
Estimated market value
Not available
Estimated sales range
Not available
Not available
Price history
Price history is unavailable.
Public tax history
| Year | Property taxes | Tax assessment |
|---|---|---|
| 2024 | $4,051 +3.6% | $42,848 +8% |
| 2023 | $3,910 -7.8% | $39,670 +11.7% |
| 2022 | $4,240 +7.3% | $35,521 -5.9% |
| 2021 | $3,950 +1.9% | $37,746 +10.2% |
| 2020 | $3,878 -1.6% | $34,248 +4.6% |
| 2019 | $3,942 +0.3% | $32,751 -2% |
| 2018 | $3,931 | $33,432 +5.1% |
| 2017 | $3,931 +4.4% | $31,822 +3.6% |
| 2016 | $3,764 -28.7% | $30,710 +2.6% |
| 2015 | $5,276 +4.7% | $29,929 -31.1% |
| 2014 | $5,040 +8.3% | $43,418 +0% |
| 2012 | $4,654 +8.4% | $43,417 |
| 2011 | $4,295 -8.8% | $43,417 -19.3% |
| 2010 | $4,711 +11.4% | $53,824 +1.9% |
| 2009 | $4,227 -15.1% | $52,834 -17.6% |
| 2008 | $4,978 +10.9% | $64,086 +5.1% |
| 2006 | $4,487 +5.9% | $60,988 |
| 2005 | $4,238 +4.2% | -- |
| 2004 | $4,068 +9.6% | -- |
| 2003 | $3,712 +19.2% | -- |
| 2002 | $3,114 +2.2% | -- |
| 2001 | $3,047 +2.4% | $41,237 +3.3% |
| 2000 | $2,976 | $39,924 |
Find assessor info on the county website
Monthly payment
Climate risks
Neighborhood: 60002
Nearby schools
Schools provided by the listing agent
- District: 34
Source: MRED as distributed by MLS GRID. This data may not be complete. We recommend contacting the local school district to confirm school assignments for this home.

Similar homes
- $134,9006.1 acres23976 W Beach Grove Rd, Antioch, IL 60002Active
 MLS ID #12636552, Wayne A Sobczak, CRS,GRI, Realty World Tiffany R.E.. MRED as distributed by MLS GRID
- $200,0001.36 acres(Undisclosed Address), Antioch, IL 60002Active
 MLS ID #12668290, Michael Nielsen, Re/Max Advantage. MRED as distributed by MLS GRID
- $159,9003.18 acres8219 Squirrel Dr #20, Spring Grove, IL 60081Active
 MLS ID #12761714, Marcin Wesierski, HomeSmart Connect LLC. MRED as distributed by MLS GRID
- $200,0003.63 acres13388 W Wadsworth Rd, Wadsworth, IL 60083Active
 MLS ID #12174511, Luis Fuentes, CSC,SRES,SRS, RE/MAX Plaza. MRED as distributed by MLS GRID
