$25,000
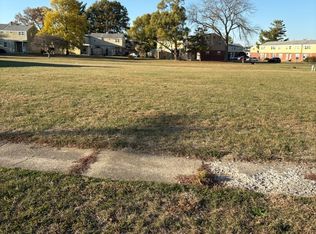
9,384 Square Feet
405 Neipswah Ave, Rantoul, IL 61866
Lot/Land
We don't have imagery for this home
Zillow last checked:
Jill Hess 217-417-8177,
RE/MAX REALTY ASSOCIATES-CHA
Not available
Estimated sales range
Not available
$706/mo
| Date | Event | Price |
|---|---|---|
| 5/22/2026 | Listing removed | $25,000 |
Source: REMAX Report a problem | ||
| 5/20/2026 | Listed for sale | $25,000 |
Source: REMAX Report a problem | ||
| 5/12/2026 | Listing removed | $25,000 |
Source: | ||
| 9/26/2025 | Listed for sale | $25,000+72.4% |
Source: | ||
| 1/29/2025 | Sold | $14,500-19.4% |
Source: | ||
| 1/16/2025 | Pending sale | $18,000 |
Source: | ||
| 2/3/2023 | Listed for sale | $18,000 |
Source: | ||
| 1/30/2023 | Listing removed | -- |
Source: | ||
| 6/22/2022 | Price change | $18,000+5.9% |
Source: | ||
| 5/5/2021 | Listed for sale | $17,000 |
Source: | ||
| 1/19/2021 | Listing removed | $17,000 |
Source: | ||
| 1/14/2021 | Listed for sale | $17,000+70% |
Source: Midwest Real Estate Data #09601958 Report a problem | ||
| 3/15/2017 | Listing removed | $10,000 |
Source: REALTY 2000, INC. #2150757 Report a problem | ||
| 10/20/2016 | Price change | $10,000-25.9% |
Source: REALTY 2000, INC. #2150757 Report a problem | ||
| 7/13/2016 | Price change | $13,500-15.6% |
Source: REALTY 2000, INC. #2150757 Report a problem | ||
| 9/17/2015 | Listed for sale | $16,000 |
Source: REALTY 2000, INC. #2150757 Report a problem | ||
| 6/8/2015 | Listing removed | $16,000 |
Source: RE/MAX FOR YOU REALTY #2150757 Report a problem | ||
| 3/4/2015 | Listed for sale | $16,000 |
Source: RE/MAX FOR YOU REALTY #2150757 Report a problem | ||
| Year | Property taxes | Tax assessment |
|---|---|---|
| 2024 | $210 -2.1% | $2,160 +11.9% |
| 2023 | $214 +6.3% | $1,930 +12.2% |
| 2022 | $202 +3.7% | $1,720 +6.8% |
| 2021 | $194 +6.8% | $1,610 +3.2% |
| 2020 | $182 -21.7% | $1,560 +4% |
| 2019 | $233 | $1,500 -18% |
| 2018 | $233 +254.5% | $1,830 +381.6% |
| 2017 | $66 +1.4% | $380 |
| 2016 | $65 | $380 |
| 2015 | $65 +1.5% | $380 |
| 2014 | $64 +0.1% | $380 -2.6% |
| 2013 | $64 +3.5% | $390 |
| 2012 | $62 +30.9% | $390 -4.9% |
| 2011 | $47 +3.4% | $410 -2.4% |
| 2010 | $45 | $420 |
| 2009 | -- | $420 -2.3% |
| 2008 | -- | $430 +4.9% |
| 2007 | $42 +2% | $410 +5.1% |
| 2006 | $42 +4.5% | $390 +5.4% |
| 2005 | $40 +6.1% | $370 +2.8% |
| 2004 | $37 +5.6% | $360 +2.9% |
| 2003 | $35 +2.5% | $350 +2.9% |
| 2002 | $35 +11.2% | $340 |
| 2001 | $31 +6% | $340 +6.3% |
| 2000 | $29 | $320 |
Source: MRED as distributed by MLS GRID. This data may not be complete. We recommend contacting the local school district to confirm school assignments for this home.
A local agent can set up tours, give advice and negotiate with sellers.