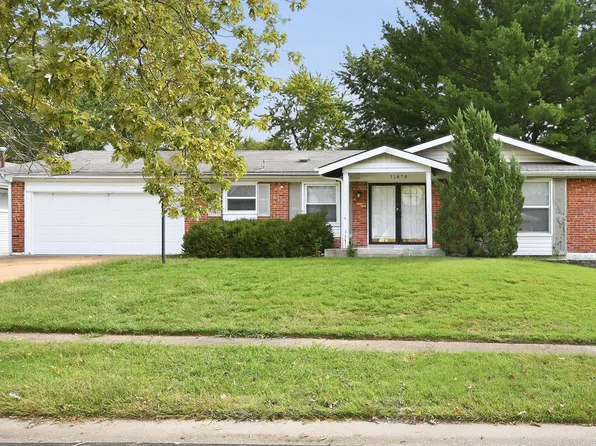
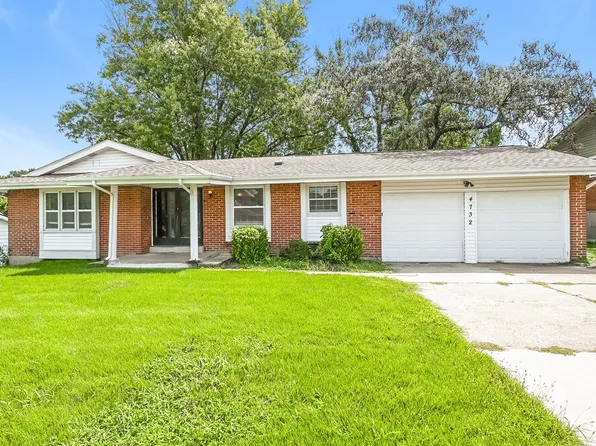
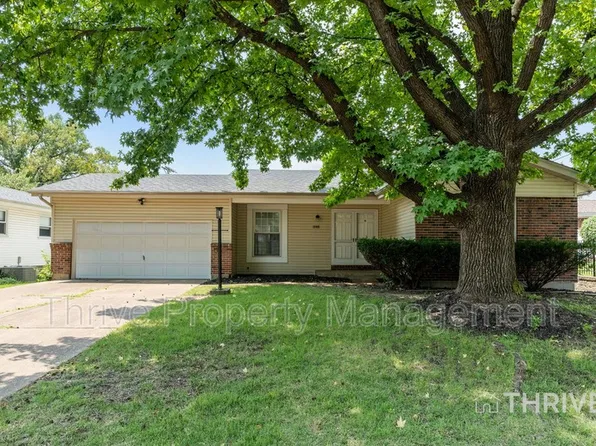
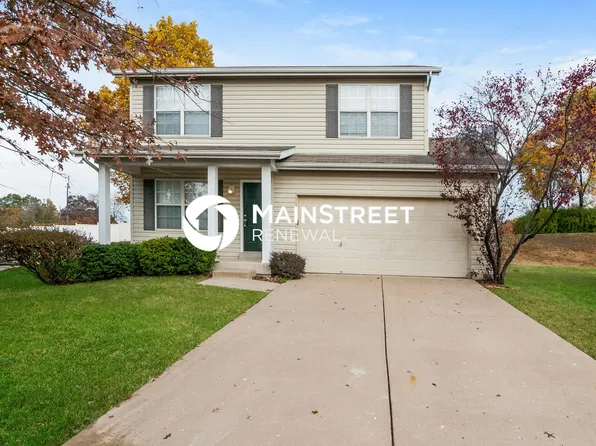
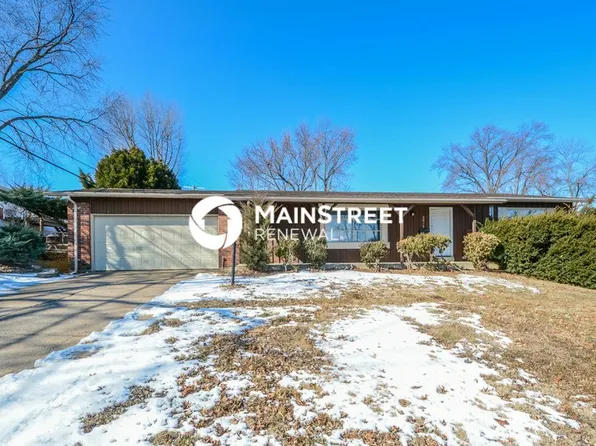
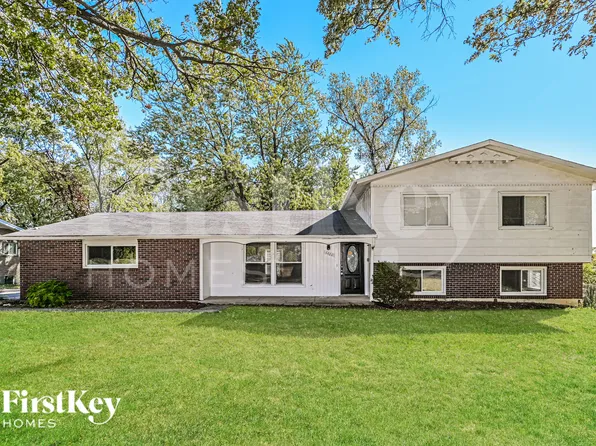
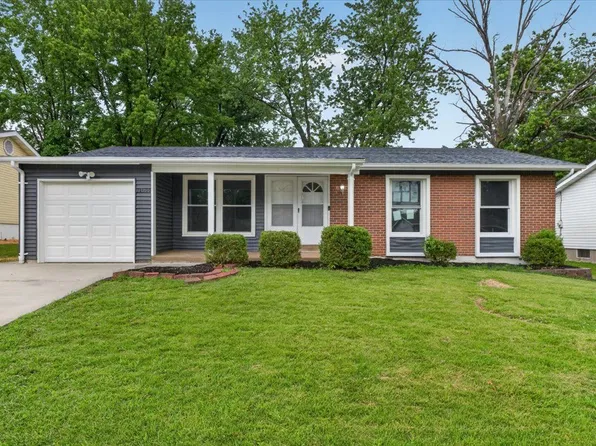
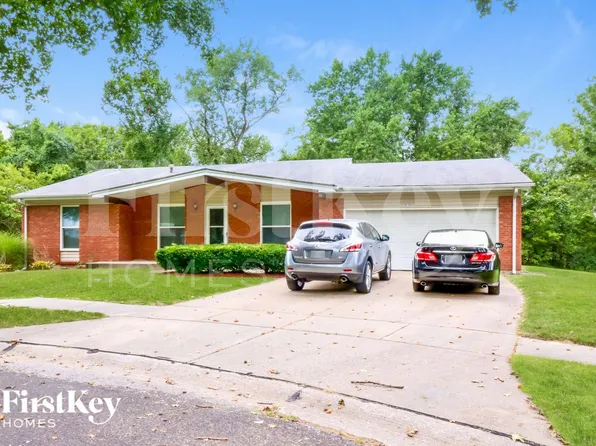
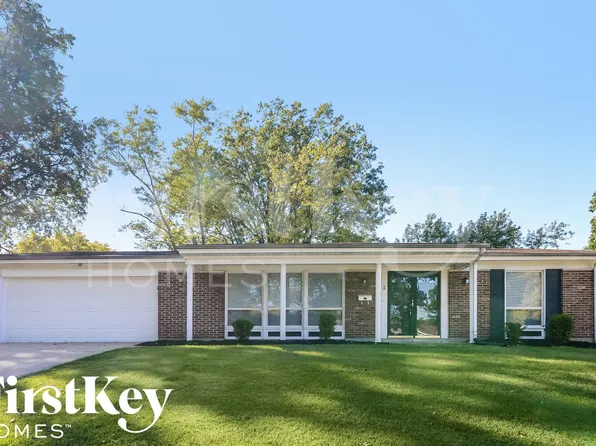
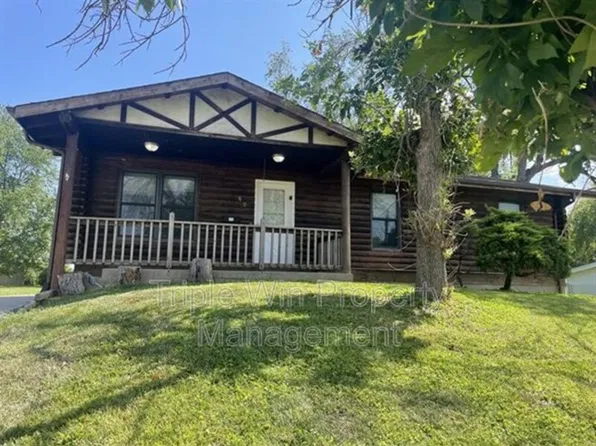
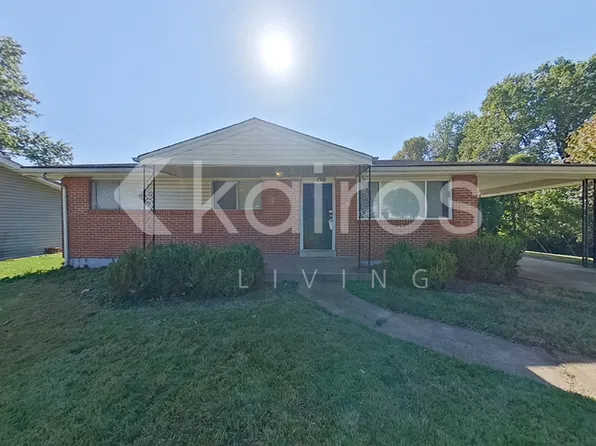
$816+ 2bd$1,626+ 3bd$1,386+ 5bd
Black Jack MO Rental Listings
18 rentals available
Loading...
Loading...
Loading...
End of matching results
Similar results nearby
Results within 3 miles- $940+ 1bd$1,050+ 2bd
- 4504 Robbins Grove Dr, Florissant, MO 63034
- 4 bds
- 2.5 ba
- 1,890 sqft
- 11205 Old Halls Ferry Rd, Saint Louis, MO 63136
- 3 bds
- 1.5 ba
- 1,050 sqft
- $875+ 1bd$975+ 2bd
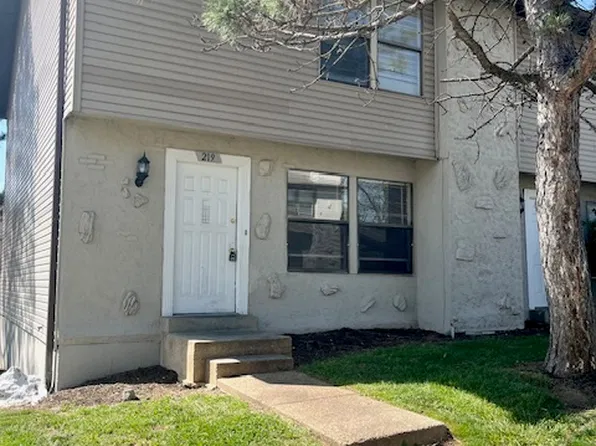
- 219 Northport Hills Dr, Florissant, MO 63033
- 3 bds
- 2.5 ba
- 1,600 sqft
- $850+ 1bd$1,100+ 2bd
to get email alerts when listings hit the market.
Renting in Black Jack MO: Frequently Asked Questions
How much is rent in Black Jack MO?
The average rent price across all property types in Black Jack is $1,937 per month. Available rentals in Black Jack start at $804 per month and go up to $2,250 depending on size, property type and neighborhood. A common budgeting guideline is to keep rent at or below 30% of gross monthly income.
Are rents going up or down in Black Jack MO?
The average rent in Black Jack is $1,937 per month. That reflects a change of +$92 compared with last month and +$17 compared with this time last year. Rent trends in Black Jack vary by property type and unit size, so filter your search to get specific price variations.
How many rentals are available in Black Jack?
There are 5 rentals available in Black Jack right now. Inventory changes daily, so save your search to get notified when new listings match what you are looking for, and filter by price, bedrooms, property type and pet policy to narrow the list.
How much do I need to make to afford rent in Black Jack?
The average rent in Black Jack is $1,937 per month. A common budgeting guideline is to keep rent at or below 30% of gross monthly income, with this guidance in mind it means you’d need to make around $5,811 per month to comfortably afford rent in Black Jack.