Bring your vision and make it your own! Situated on over 10 acres with woods, wildlife, and privacy, this 3-bedroom, 2-bath home offers an opportunity to create your own peaceful retreat. A sunroom provides the perfect spot to relax and enjoy the natural surroundings. If you're looking for a home to fix up with room to roam, this could be the one!
For sale
$120,000
10171 Tanzy Rd, Cannelton, IN 47520
3beds
1,436sqft
Single Family Residence
Built in 1998
10 Acres Lot
$148,700 Zestimate®
$84/sqft
$-- HOA
What's special
- 7 hours
- 153
- 16
Zillow last checked:
Listing updated:
Listed by:
Patricia Seibert 812-719-2333,
Indiana Realty Group
Source: My State MLS,MLS#: 12033630
Facts & features
Interior
Bedrooms & bathrooms
- Bedrooms: 3
- Bathrooms: 2
- Full bathrooms: 2
Basement
- Area: 0
Heating
- Has Heating (Unspecified Type)
Features
- Has basement: No
- Has fireplace: No
Interior area
- Total structure area: 1,436
- Total interior livable area: 1,436 sqft
- Finished area above ground: 1,436
Property
Lot
- Size: 10 Acres
Details
- Parcel number: 621416300019000005
- Lease amount: $0
Construction
Type & style
- Home type: SingleFamily
- Property subtype: Single Family Residence
Condition
- New construction: No
- Year built: 1998
Utilities & green energy
- Electric: Amps(0)
Community & HOA
HOA
- Has HOA: No
Location
- Region: Cannelton
Financial & listing details
- Price per square foot: $84/sqft
- Tax assessed value: $81,900
- Annual tax amount: $1,200
- Date on market: 10/19/2026
- Date available: 10/19/2026
- Listing agreement: Exclusive
Estimated market value
$148,700
$141,000 - $156,000
Not available
Price history
| Date | Event | Price |
|---|---|---|
| 10/19/2026 | Listed for sale | $120,000-9.8%$84/sqft |
Source: My State MLS #12033630 Report a problem | ||
| 10/1/2026 | Listing removed | $133,000$93/sqft |
Source: My State MLS #11412215 Report a problem | ||
| 6/29/2026 | Price change | $133,000-2.9%$93/sqft |
Source: My State MLS #11412215 Report a problem | ||
| 5/4/2026 | Price change | $137,000-3.5%$95/sqft |
Source: My State MLS #11412215 Report a problem | ||
| 4/9/2026 | Listed for sale | $142,000$99/sqft |
Source: My State MLS #11412215 Report a problem | ||
| 3/27/2026 | Contingent | $142,000$99/sqft |
Source: My State MLS #11412215 Report a problem | ||
| 2/6/2026 | Listed for sale | $142,000$99/sqft |
Source: My State MLS #11412215 Report a problem | ||
| 1/21/2026 | Listing removed | $142,000$99/sqft |
Source: My State MLS #11412215 Report a problem | ||
| 12/8/2025 | Price change | $142,000-2.7%$99/sqft |
Source: My State MLS #11412215 Report a problem | ||
| 10/1/2025 | Price change | $146,000-2.3%$102/sqft |
Source: My State MLS #11412215 Report a problem | ||
| 7/23/2025 | Price change | $149,500-0.3%$104/sqft |
Source: My State MLS #11412215 Report a problem | ||
| 6/9/2025 | Price change | $150,000-2%$104/sqft |
Source: My State MLS #11412215 Report a problem | ||
| 5/12/2025 | Price change | $153,000-1.9%$107/sqft |
Source: My State MLS #11412215 Report a problem | ||
| 3/31/2025 | Price change | $156,000-2.5%$109/sqft |
Source: My State MLS #11412215 Report a problem | ||
| 3/10/2025 | Listed for sale | $160,000$111/sqft |
Source: My State MLS #11412215 Report a problem | ||
| 3/3/2025 | Contingent | $160,000$111/sqft |
Source: My State MLS #11412215 Report a problem | ||
| 1/21/2025 | Listed for sale | $160,000-5.3%$111/sqft |
Source: My State MLS #11412215 Report a problem | ||
| 1/16/2024 | Listing removed | -- |
Source: My State MLS #11191477 Report a problem | ||
| 9/5/2023 | Price change | $169,000-4.5%$118/sqft |
Source: My State MLS #11191477 Report a problem | ||
| 8/7/2023 | Price change | $177,000-3.3%$123/sqft |
Source: My State MLS #11191477 Report a problem | ||
| 7/17/2023 | Listed for sale | $183,000$127/sqft |
Source: My State MLS #11191477 Report a problem | ||
Public tax history
| Year | Property taxes | Tax assessment |
|---|---|---|
| 2025 | $749 -0.3% | $81,900 +8.6% |
| 2024 | $751 -1.2% | $75,400 +0.8% |
| 2023 | $760 +99.7% | $74,800 +0.5% |
| 2022 | $381 +3.2% | $74,400 +60.3% |
| 2021 | $369 +6.3% | $46,400 +2.9% |
| 2020 | $347 +18.3% | $45,100 +2.7% |
| 2019 | $293 +8.6% | $43,900 +2.6% |
| 2018 | $270 -9% | $42,800 +5.4% |
| 2017 | $297 | $40,600 +57.4% |
| 2016 | $297 -3.5% | $25,800 -50.5% |
| 2014 | $308 -4.9% | $52,100 +1.2% |
| 2013 | $323 -27.8% | $51,500 -2.8% |
| 2012 | $448 -17.1% | $53,000 -27% |
| 2011 | $540 -6.5% | $72,600 |
| 2010 | $578 -0.9% | $72,600 |
| 2009 | $583 | $72,600 |
Find assessor info on the county website
Monthly payment
Est. payment
Payment breakdown
Explore the cost of this home by adjusting the details. Changes won't be saved.Climate risks
Neighborhood: 47520
Similar homes
- $119,0004 bd2 ba1.2k sqft7 Pleasant Valley Dr, Cannelton, IN 47520For Sale
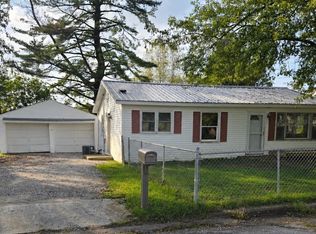 MLS ID #12033595, Amanda Litherland, Indiana Realty Group. My State MLS
- $129,0002 bd1 ba780 sqft6670 Scotch Pine Rd, Cannelton, IN 47520For Sale
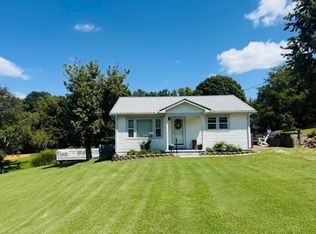 MLS ID #11979416, Patricia Seibert, Indiana Realty Group. My State MLS
- $119,9004 bd1 ba1.1k sqft727 Saint Louis Ave, Cannelton, IN 47520For Sale
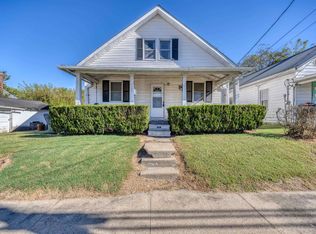 MLS ID #202641520, Amanda Hall, Key Associates Signature Realty. IRMLS
- $162,0003 bd1 ba1k sqft11075 Smith Cemetery Rd, Tell City, IN 47586For Sale
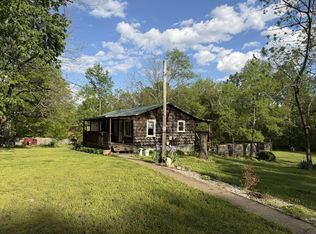 MLS ID #11732319, Travis Sommer, Indiana Realty Group. My State MLS
- $124,0002 bd1 ba864 sqft890 Pell St, Lewisport, KY 42351For Sale
 MLS ID #95385, VANOVER TEAM C, Greater Owensboro Realty Co.. Greater Owensboro Realtor Association
- $89,9002 bd1 ba1.2k sqft2579 Happy Hollow Rd, Hawesville, KY 42348For Sale
 MLS ID #1728538, Carmen P Mckenzie, 85W Real Estate. Metro Search Inc. LLC DBA Apex MLS
- $180,0003 bd3 ba1.5k sqft10290 N Highway 261, Webster, KY 40176For SaleMLS ID #1726056, Rachel L Stephens, NextHome Chism Realty. Metro Search Inc. LLC DBA Apex MLS
- $100,5002 bd2 ba1.1k sqft10005 E Highway 144, Stephensport, KY 40170For SaleMLS ID #1724551, Sherry L Bennett-Webb, Bennett-Webb Realty. Metro Search Inc. LLC DBA Apex MLS
- $149,9005 bd2 ba1.5k sqft2224 State Route 334, Lewisport, KY 42351For SaleMLS ID #95963, Lizbeth Gonzalez, Triple Crown Realty Group. Greater Owensboro Realtor Association
