This 2720 square foot single family home has 4 bedrooms and 4.0 bathrooms. This home is located at 1025 SE 3rd St, Belle Glade, FL 33430.
Foreclosed
Street View
Est. $313,027
1025 SE 3rd St, Belle Glade, FL 33430
4beds
2,720sqft
SingleFamily
Built in 1972
0.52 Acres Lot
$-- Zestimate®
$115/sqft
$-- HOA
Overview
- 58 days
- 65
- 2
Facts & features
Interior
Bedrooms & bathrooms
- Bedrooms: 4
- Bathrooms: 4
- Full bathrooms: 4
Heating
- Forced air, Electric, Gas
Cooling
- Central
Appliances
- Included: Dishwasher, Microwave, Range / Oven, Refrigerator
Features
- Flooring: Tile
- Basement: None
- Has fireplace: Yes
Interior area
- Total interior livable area: 2,720 sqft
Property
Parking
- Total spaces: 7
- Parking features: Garage
Features
- Exterior features: Stone, Stucco, Brick, Cement / Concrete
- Has spa: Yes
Lot
- Size: 0.52 Acres
Details
- Parcel number: 04374405070000160
Construction
Type & style
- Home type: SingleFamily
Materials
- masonry
- Roof: Metal
Condition
- Year built: 1972
Community & HOA
Location
- Region: Belle Glade
Financial & listing details
- Price per square foot: $115/sqft
- Tax assessed value: $313,027
- Annual tax amount: $7,564
Foreclosure details
Estimated market value
Not available
Estimated sales range
Not available
$4,306/mo
Price history
| Date | Event | Price |
|---|---|---|
| 9/8/2026 | Sold | $218,200+28.7%$80/sqft |
Source: Public Record Report a problem | ||
| 7/13/2004 | Sold | $169,500+69.5%$62/sqft |
Source: Public Record Report a problem | ||
| 12/18/1997 | Sold | $100,000+126.8%$37/sqft |
Source: Public Record Report a problem | ||
| 9/20/1996 | Sold | $44,100$16/sqft |
Source: Public Record Report a problem | ||
Public tax history
| Year | Property taxes | Tax assessment |
|---|---|---|
| 2025 | $7,564 -3.3% | $313,027 -3.7% |
| 2024 | $7,819 +9.2% | $325,216 +13.1% |
| 2023 | $7,158 +6.4% | $287,607 +10% |
| 2022 | $6,726 +10.9% | $261,461 +10% |
| 2021 | $6,066 +157.4% | $237,692 +89.4% |
| 2020 | $2,356 +2% | $125,499 +2.3% |
| 2019 | $2,310 | $122,677 +1.9% |
| 2018 | $2,310 +4.9% | $120,390 +2.1% |
| 2017 | $2,201 +2.4% | $117,914 +2.1% |
| 2016 | $2,149 +1% | $115,489 +0.7% |
| 2015 | $2,128 -1.3% | $114,686 +0.8% |
| 2014 | $2,156 +1.9% | $113,776 +1.5% |
| 2013 | $2,116 -13.1% | $112,095 -9.8% |
| 2012 | $2,435 -31.1% | $124,232 -24.6% |
| 2011 | $3,535 -0.4% | $164,715 0% |
| 2010 | $3,549 -26.8% | $164,740 -25.1% |
| 2009 | $4,851 +7.8% | $220,019 +0.1% |
| 2008 | $4,500 -1.9% | $219,799 +3% |
| 2007 | $4,585 -3.1% | $213,397 +2.5% |
| 2006 | $4,734 | $208,192 +3% |
| 2005 | -- | $202,128 +44.6% |
| 2004 | $1,903 +927.2% | $139,749 +1.9% |
| 2003 | $185 -91.1% | $137,143 -3.2% |
| 2002 | $2,092 -31.3% | $141,632 +1.8% |
| 2001 | $3,044 +2.6% | $139,106 +3% |
| 2000 | $2,967 +4% | $135,054 -3.9% |
| 1999 | $2,854 | $140,468 |
Find assessor info on the county website
Monthly payment
Climate risks
Neighborhood: 33430
Similar homes
- $350,0001 bd3 ba1.9k sqft577 SW 8TH STREET, BELLE GLADE, FL 33430For Sale
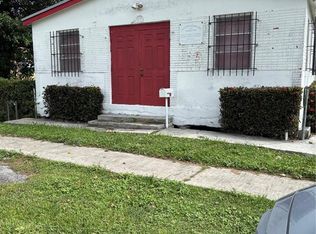
 MLS ID #TB8564451, Merrill Williams, THOMAS ASSOCIATES REALTY INC. Stellar MLS
- $395,0005 bd3 ba2.5k sqft9 NW AVENUE D, Belle Glade, FL 33430For Sale

 MLS ID #B26089815, Shalene KJ Brostek, KW Reserve. BeachesMLS
- $385,0004 bd2 ba1.4k sqft157 Dabou Loop, Belle Glade, FL 33430For Sale
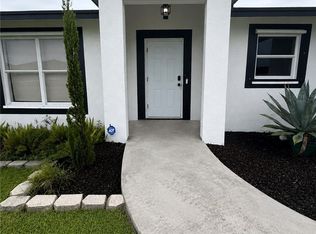
 MLS ID #2026037293, Veronica Hernandez, Starlink Realty, Inc. Florida Gulf Coast MLS
- $358,0003 bd2 ba1.6k sqft24 NW Avenue I, Belle Glade, FL 33430For Sale
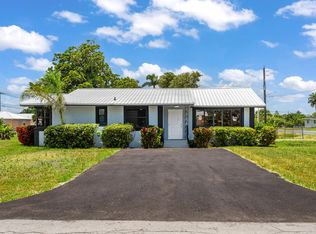 MLS ID #B26043707, Leonor Depaz, Partnership Realty Inc.. BeachesMLS
- $419,0004 bd3 ba2.2k sqftNone, Belle Glade, FL 33430For Sale
 MLS ID #A12045207, Kelly Williamson, Kelly Williamson. MIAMI
- $395,0003 bd2 ba1.4k sqft1117 NE 23RD Street, Belle Glade, FL 33430For SaleMLS ID #B26062729, Teresa Sullivan, RE/MAX Prestige Realty/RPB. BeachesMLS
- $250,0003 bd2 ba1.4k sqft632 SW 13th Street, Belle Glade, FL 33430For SaleMLS ID #R11126683, Leonard Neal, Reliant Realty ERA Powered. BeachesMLS
- $414,9994 bd3 ba2k sqft955 NW 4th St Street, Belle Glade, FL 33430For SaleMLS ID #R11158700, Damixy Huertas, RE/MAX Prestige Realty/Wellington. BeachesMLS
- $390,0004 bd2 ba1.7k sqft113 Dabou Loop, Belle Glade, FL 33430For SaleMLS ID #R11162162, Tamara Starks, E.R. Morgan Realty Inc.. BeachesMLS
- $315,0004 bd3 ba2.1k sqft236 E Arcade Ave, Clewiston, FL 33440For SaleMLS ID #2026035829, Luan Walker, Sugar Realty, Inc.. Florida Gulf Coast MLS
- $299,4653 bd2 ba1.5k sqftSummerlins, South Bay, FL 33493For SaleMLS ID #A12086775, Todd Simonson, Cornerstone Real Estate Broker. MIAMI
- $425,0004 bd3 ba2.2k sqft870 E Main Street, Pahokee, FL 33476For SaleMLS ID #B26090795, Rosalba Ascencio, LoKation. BeachesMLS
- $320,0003 bd2 ba1.4k sqft722 E Concordia Ave, Clewiston, FL 33440For SaleMLS ID #2026033581, Luan Walker, Sugar Realty, Inc.. Florida Gulf Coast MLS
- $264,9994 bd2 ba1.3k sqft165 NW 11TH Avenue, South Bay, FL 33493For SaleMLS ID #B26057062, Claudine M Le Mignot, First Int'l Financial Services. BeachesMLS
- $369,0004 bd2 ba1.6k sqft111 E Sugarland Cir, Clewiston, FL 33440For SaleMLS ID #2026023846, Moe Mossa, Savvy Avenue, LLC. Florida Gulf Coast MLS
- $380,0002 bd2 ba2k sqft417 ROYAL PALM Avenue, Clewiston, FL 33440For SaleMLS ID #B26076920, Tiffany Washington, Samson Companies, LLC. BeachesMLS
- $425,0004 bd3 ba2.3k sqft610 E Avenida Del Rio, Clewiston, FL 33440For SaleMLS ID #2025026203, Lisa Walker, Sugar Realty, Inc.. Florida Gulf Coast MLS
- $399,0003 bd2 ba2k sqft312 W Circle Dr, Clewiston, FL 33440For SaleMLS ID #2026031455, Vivian Regalado, Sugar Realty, Inc.. Florida Gulf Coast MLS
- $429,0003 bd3 ba2.2k sqft444 E Osceola Ave, Clewiston, FL 33440For SaleMLS ID #2026026777, Cheryl Gutjahr, Rawls Real Estate. Florida Gulf Coast MLS
