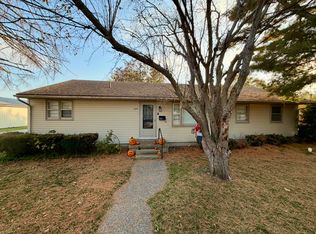
Built in 1980. Has many 80's features. Dated decor and space for the era it was built. Extra large garage built for (2) cars. Large yard surrounds the whole house. Quiet neighborhood. Good school. Minutes from (2) different larger towns. Recently added back parch area. This is an AS IS SALE.
For sale by owner
Street View
$119,000
104 E McKinley St, Maroa, IL 61756
3beds
1,540sqft
SingleFamily
Built in 1980
9,600 Square Feet Lot
$151,600 Zestimate®
$77/sqft
$-- HOA
Overview
- 15 hours
- 112
- 7
Listed by:
Property Owner (217) 259-3831
Facts & features
Interior
Bedrooms & bathrooms
- Bedrooms: 3
- Bathrooms: 2
- Full bathrooms: 1
- 1/4 bathrooms: 1
Heating
- Forced air, Electric, Gas
Cooling
- Central
Appliances
- Included: Dishwasher, Dryer, Freezer, Microwave, Range / Oven, Refrigerator, Washer
Features
- Flooring: Tile, Carpet, Laminate, Linoleum / Vinyl
- Basement: None
- Has fireplace: Yes
Interior area
- Total interior livable area: 1,540 sqft
Property
Parking
- Total spaces: 2
- Parking features: Garage - Attached
Features
- Exterior features: Wood
- Has view: Yes
- View description: City
Lot
- Size: 9,600 Square Feet
Details
- Parcel number: 100211157001
Construction
Type & style
- Home type: SingleFamily
Materials
- Frame
- Foundation: Crawl/Raised
- Roof: Tile
Condition
- New construction: No
- Year built: 1980
Community & HOA
Location
- Region: Maroa
Financial & listing details
- Price per square foot: $77/sqft
- Tax assessed value: $39,761
- Annual tax amount: $2,571
- Date on market: 11/8/2026
Estimated market value
$151,600
$132,000 - $168,000
$1,229/mo
Price history
| Date | Event | Price |
|---|---|---|
| 11/8/2026 | Listed for sale | $119,000+67.6%$77/sqft |
Source: Owner Report a problem | ||
| 10/1/1998 | Sold | $71,000$46/sqft |
Source: Agent Provided Report a problem | ||
Public tax history
| Year | Property taxes | Tax assessment |
|---|---|---|
| 2025 | $2,571 +0.4% | $39,761 +1.9% |
| 2024 | $2,560 +9.2% | $39,035 +7.6% |
| 2023 | $2,343 +8.4% | $36,271 +6% |
| 2022 | $2,163 +5.9% | $34,214 +5.3% |
| 2021 | $2,042 +4.3% | $32,499 +2.5% |
| 2020 | $1,957 +7.9% | $31,718 +3.6% |
| 2019 | $1,813 +5.5% | $30,625 +2.4% |
| 2018 | $1,718 -4.2% | $29,899 -0.4% |
| 2017 | $1,793 -20.6% | $30,025 +0.1% |
| 2016 | $2,259 +6.6% | $29,989 +3% |
| 2015 | $2,119 +3.6% | $29,116 +1% |
| 2014 | $2,047 -1% | $28,828 |
| 2013 | $2,066 +5.9% | $28,828 |
| 2012 | $1,952 | $28,828 |
| 2011 | -- | $28,828 -4% |
| 2010 | -- | $30,020 |
| 2009 | -- | $30,020 +10.8% |
| 2006 | -- | $27,085 |
| 2005 | -- | $27,085 |
Find assessor info on the county website
Monthly payment
Est. payment
Payment breakdown
Explore the cost of this home by adjusting the details. Changes won't be saved.Climate risks
Neighborhood: 61756
Similar homes
- $125,0003 bd1 ba1.7k sqft214 N Wood St, Maroa, IL 61756For Sale By Owner

- $104,0003 bd1 ba1.4k sqft232 S Locust St, Maroa, IL 61756For Sale
 MLS ID #6259472, Tony Piraino. CIBR
- $120,0002 bd1 ba1.3k sqft10430 Newburg Ct, Argenta, IL 62501For Sale By Owner
- $127,5003 bd2 ba1.5k sqft320 E Webster St, Clinton, IL 61727Active
 MLS ID #12795834, Gavin Devore, Century 21 Quest. MRED as distributed by MLS GRID
